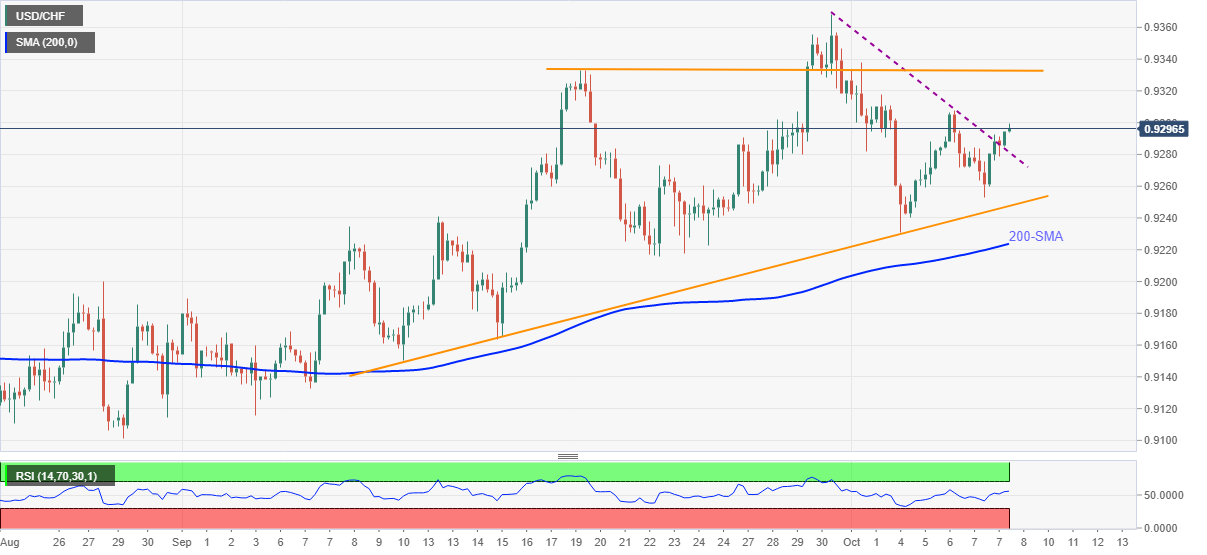
USD/CHF Price Analysis: Crosses weekly resistances line to poke 0.9300
- USD/CHF stays firmer around intraday top, pares weekly losses.
- Monthly rising triangle restricts short-term moves amid firmer RSI.
- 200-SMA break will validate bearish chart pattern confirmation.

USD/CHF buyers cheer an upside break of a one-week-old resistance line, now support, while edging higher around 0.9300 as European traders brace for Friday’s bell.
Given the RSI line trending upwards, the latest resistance break will help the pair bulls to keep reins.
In doing so, the quote may rise towards the upper line of the one-month-old ascending triangle, near 0.9330. However, any further upside will need to cross September’s high of 0.9368 to keep the fort.
It should be noted that the USD/CHF advances past 0.9368 will aim for the 0.9400 threshold before highlighting the yearly peak near 0.9470.
On the flip side, the resistance-turned-support and the lower line of the stated triangle, respectively near 0.9280 and 0.9245, will question the pair’s short-term downside.
Even if the USD/CHF falls below the 0.9245 support, theoretically confirming the bearish move, the 200-SMA level of 0.9223 will probe the south run.
USD/CHF: Four-hour chart
Trend: Further upside expected
Author

Anil Panchal
FXStreet
Anil Panchal has nearly 15 years of experience in tracking financial markets. With a keen interest in macroeconomics, Anil aptly tracks global news/updates and stays well-informed about the global financial moves and their implications.


