|

USD/CHF Price Analysis: Closes to the 50-DMA after reclaiming 0.9250

  • USD/CHF is subdued but looms around the 50-day EMA, at around 0.9282.
  • In the short term, the USD/CHF is range-though slightly tilted upwards, and it might rise to 0.9300.

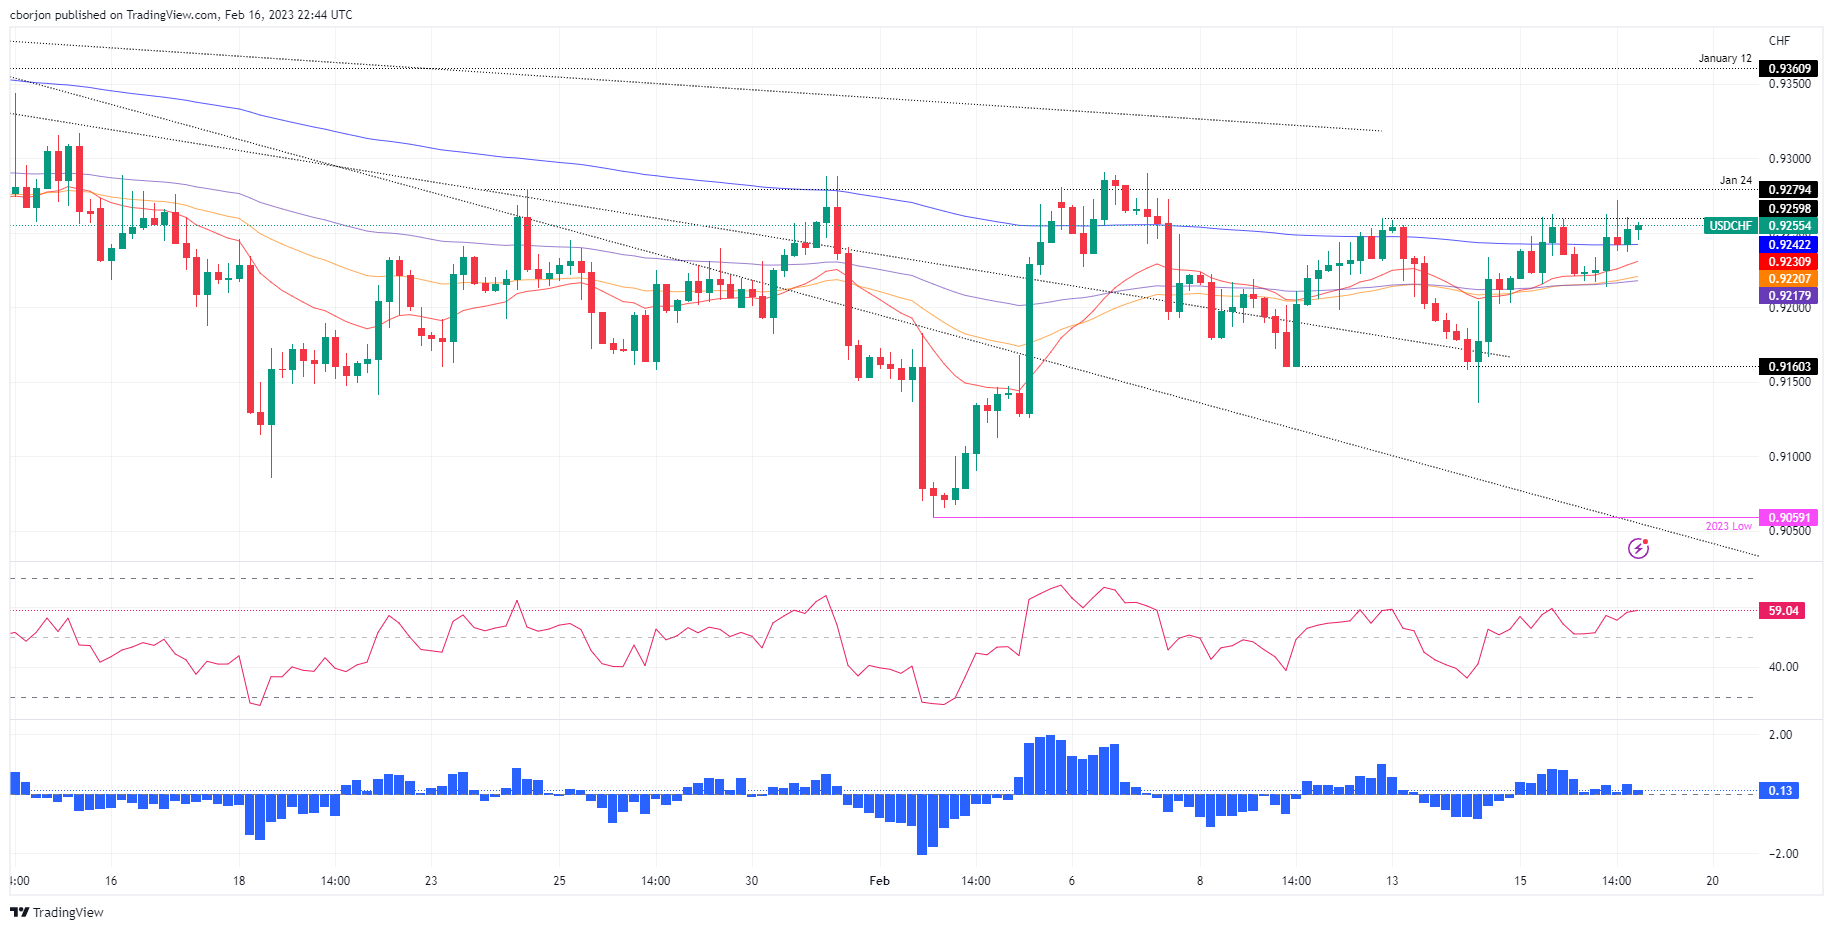
USD/CHF edges higher above the 20-day Exponential Moving Average (EMA) at 0.9221 and is threatening to register a daily close above Wednesday’s high of 0.9262, cementing a bullish continuation in the USD/CHF. At the time of typing, the USD/CHF is trading at 0.9256 after hitting a daily low of 0.9213.

As the Asian session begins, the USD/CHF daily chart depicts the pair distanced from the 20-day EMA and threatened to break the 50-day Exponential Moving Average (EMA) at 0.9282, though it fell short and retraced. Traders should be aware that the Relative Strength Index (RSI) shifted to bullish territory, but it’s flat, meaning buyers are getting a respite before launching an assault on the 50-day EMA. As an alternate scenario, If the USD/CHF tumbles below the 20-day EMA at 0.9221, that would expose the 0.9200 figure, followed by the current week low of 0.9139.

On an intraday time frame, the USD/CHF 4-Hour chart suggests the pair is sideways, within the 0.9160/0.9260 range, but the jump from YTD lows at around 0.9059 opened the door for further upside.

A breach of 0.9260 will expose the 0.9300 figure, which would be up for grabs. A move upward and January 12 at 0.9360 would be the bears’ next line of defense, followed by the psychological 0.9400 mark.

On the downside, sellers need to break below the 200-EMA at 0.9242. Once done, the confluence of the 20/50 EMA around 0.9220/30 would be tested ahead of 0.9200.

USD/CHF 4-Hour chart

USD/CHF Key technical levels

USD/CHF

Overview
Today last price0.9254
Today Daily Change0.0017
Today Daily Change %0.18
Today daily open0.9237
 
Trends
Daily SMA200.9206
Daily SMA500.9254
Daily SMA1000.9505
Daily SMA2000.9594
 
Levels
Previous Daily High0.9263
Previous Daily Low0.9212
Previous Weekly High0.9291
Previous Weekly Low0.916
Previous Monthly High0.941
Previous Monthly Low0.9085
Daily Fibonacci 38.2%0.9243
Daily Fibonacci 61.8%0.9231
Daily Pivot Point S10.9212
Daily Pivot Point S20.9186
Daily Pivot Point S30.916
Daily Pivot Point R10.9263
Daily Pivot Point R20.9288
Daily Pivot Point R30.9314

Author

Christian Borjon Valencia

Christian Borjon began his career as a retail trader in 2010, mainly focused on technical analysis and strategies around it. He started as a swing trader, as he used to work in another industry unrelated to the financial markets.

More from Christian Borjon Valencia
Share:

Markets move fast. We move first.

Orange Juice Newsletter brings you expert driven insights - not headlines. Every day on your inbox.

By subscribing you agree to our Terms and conditions.

Editor's Picks

EUR/USD bounces toward 1.1750 as US Dollar loses strength

EUR/USD returned to the 1.1750 price zone in the American session on Friday, despite falling Wall Street, which indicates risk aversion. Trading conditions remain thin following the New Year holiday and ahead of the weekend, with the focus shifting to US employment and European data scheduled for next week.

GBP/USD nears 1.3500, holds within familiar levels

After testing 1.3400 on the last day of 2025, GBP/USD managed to stage a rebound. Nevertheless, the pair finds it difficult to gather momentum and trades with modest intraday gains at around 1.3490 as market participants remain in holiday mood.

Gold trims intraday gains, approaches $4,300

Gold retreated sharply from the $4,400  area and trades flat for the day in the $4,320 price zone. Choppy trading conditions exacerbated the intraday decline, although XAU/USD bearish case is out of the picture, considering growing expectations for a dovish Fed and persistent geopolitical tensions.

Cardano gains early New Year momentum, bulls target falling wedge breakout

Cardano kicks off the New Year on a positive note and is extending gains, trading above $0.36 at the time of writing on Friday. Improving on-chain and derivatives data point to growing bullish interest, while the technical outlook keeps an upside breakout in focus.

Economic outlook 2026-2027 in advanced countries: Solidity test

After a year marked by global economic resilience and ending on a note of optimism, 2026 looks promising and could be a year of solid economic performance. In our baseline scenario, we expect most of the supportive factors at work in 2025 to continue to play a role in 2026.

Crypto market outlook for 2026

Year 2025 was volatile, as crypto often is.  Among positive catalysts were favourable regulatory changes in the U.S., rise of Digital Asset Treasuries (DAT), adoption of AI and tokenization of Real-World-Assets (RWA).