|

USD/CHF Price Analysis: Climbs to 0.9250s on broad US Dollar strength

  • The USD/CHF downfall stalled around 0.9200 as a triple bottom emerged.
  • A falling wedge and oscillator flashing selling pressure waning could pave the way for further upside in the USD/CHF.
  • USD/CHF is poised for a break above 0.9300 as it eyes a test of the 20-day EMA.

The Swiss Franc (CHF) bounces at around 0.9200 and climbs toward 0.9250s amidst the North American session, which witnessed light liquidity conditions in the observance of 2023 new year’s eve. Therefore, the lack of US and Swiss economic data left traders adrift to market mood and technical. At the time of writing, the USD/CHF is trading at 0.9255, above its opening price by 0.15%.

USD/CHF Price Analysis: Technical outlook

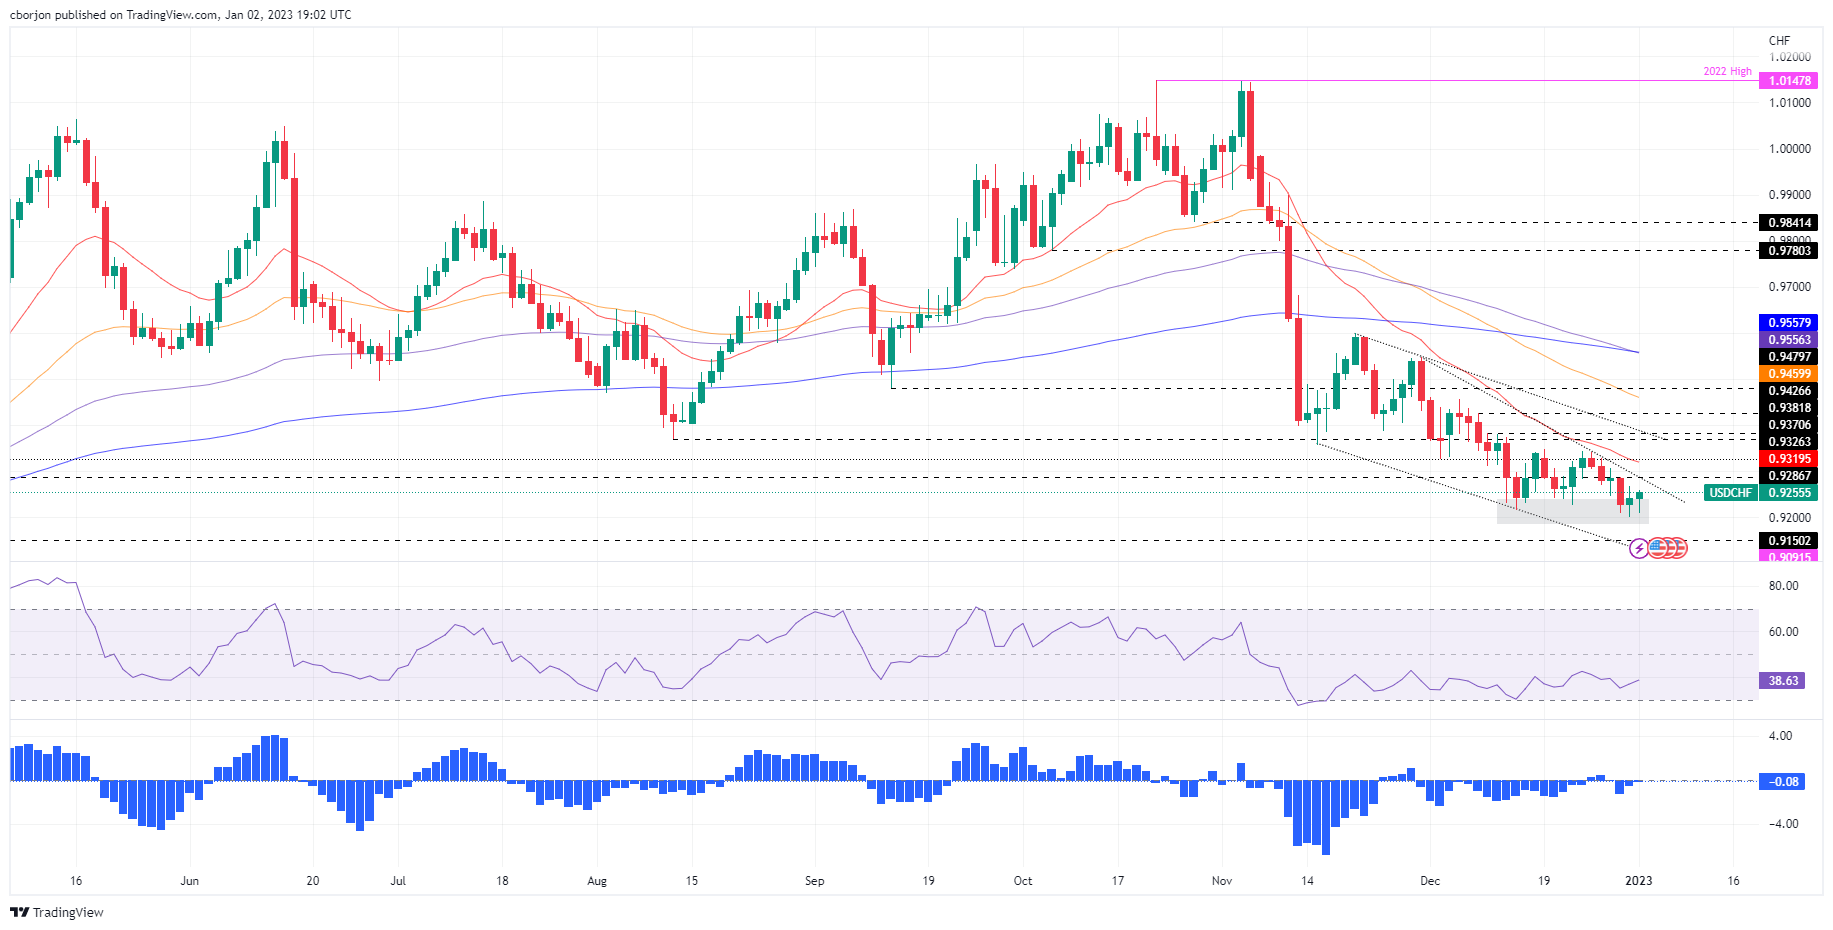
The daily chart displays the pair as downward biased, but it also appears to have bottomed at around 0.9200. Since December, the USD/CHF pair’s inability to break below 0.9200, forming a triple bottom, opened the door for a leg-up, though low liquidity conditions since the last week keep the USD/CHF pair unable to test the 0.9300 figure. The Relative Strength Index (RSI) remains in bearish territory, capping any rallies toward 0.9300, while the Rate of Change (RoC) displays that selling pressure is waning.

Also, the USD/CHF is forming a falling wedge that it’s bullish. Therefore, the USD/CHF might test the 0/9300 figure, closely followed by a challenge of the 20-day Exponential Moving Average (EMA) at around 0.9319. The break above will expose the top-trendline of a descending channel around 0.9370, followed by the 0.9400 figure.

USD/CHF Key Technical Levels

USD/CHF

Overview
Today last price0.9257
Today Daily Change0.0011
Today Daily Change %0.12
Today daily open0.9246
 
Trends
Daily SMA200.9318
Daily SMA500.9537
Daily SMA1000.9655
Daily SMA2000.9644
 
Levels
Previous Daily High0.9268
Previous Daily Low0.9201
Previous Weekly High0.9338
Previous Weekly Low0.9201
Previous Monthly High0.9471
Previous Monthly Low0.9201
Daily Fibonacci 38.2%0.9243
Daily Fibonacci 61.8%0.9227
Daily Pivot Point S10.9208
Daily Pivot Point S20.9171
Daily Pivot Point S30.9141
Daily Pivot Point R10.9276
Daily Pivot Point R20.9306
Daily Pivot Point R30.9343

Author

Christian Borjon Valencia

Markets analyst, news editor, and trading instructor with over 14 years of experience across FX, commodities, US equity indices, and global macro markets.

More from Christian Borjon Valencia
Share:

Editor's Picks

EUR/USD stays bid near 1.1560, focus shifts to the ECB

EUR/USD extends its weekly recovery for the third day in a row on Wednesday, navigating in a sidelined fashion around 1.1560 on the back of decent losses in the US Dollar. In the meantime, market participants continue to assess the latest US inflation data while hifting its attention to the ECB event on Thursday.

GBP/USD recedes from tops, hovers around 1.3400

GBP/USD could not sustain the initial bull run and is now slipping back toward the 1.3400 neighbourhood on Wednesday. Cable’s continuation of the ongoing leg higher follows mild selling pressure on the Greenback, despite steady uncertainty on the geopolitical front and elevated US inflation.

Gold bleeding continues as Middle East crisis escalates, Fed hike coming

Gold is accelerating its downward trends and approaches the area of $4,100 per troy ounce on Wednesday, where the 2026 bottom sits so far. The persistent decline in the precious metal almost exclusively follows the swelling opinion that the Fed will keep a cautious stance in H2, a view that was reinforced following earlier US CPI data.

$1,500: Why Ethereum just crashed 20% despite spot markets barely selling
Ethereum (ETH) recently suffered one of its sharpest declines of 2026, dropping more than 20% and briefly testing the $1,500 area. While the sell-off appeared to reflect broader market fears, derivatives and on-chain data suggest a more complex story may be unfolding beneath the surface.
Brutal sell-off: Silver deepens months-long slide, refocusing on $60

Silver has never been known for its calm temperament. The precious metal can spend weeks grinding higher before suddenly giving back months of gains in a matter of days. That volatile reputation has been on full display in recent weeks.

The US economy defies the rules: 100 days into the Oil shock and the recession signal is still missing

More than three months after the start of the Iran war and the resulting disruption to global energy markets, the US economy continues to display remarkable resilience. The conflict has triggered a sharp rise in Oil prices, reignited inflationary pressures and fueled widespread concerns about a potential economic slowdown.