|

USD/CHF Price Analysis: Advances firmly, reclaims 0.9500

  • USD/CHF extends its weekly gains, up to 1%, and erases last week’s losses.
  • The USD/CHF aims higher and could test the 20-day EMA; otherwise, a pullback could extend towards 0.9400.

The USD/CHF climbs for the second straight day, widening the gap between the 200-day EMA and the exchange rate, courtesy of broad US dollar strength, underpinned by high US T-bond yields in the mid-North American session. At the time of writing, the USD/CHF is trading at 0.9501, up by 0.55% on the day.

USD/CHF Price Analysis: Technical outlook

The USD/CHF is about to test the top-trendline of a descending channel. It’s worth noting that albeit a successive series of lower highs/lows confirm the pair is in a downtrend, sellers’ failure to capture the 200-day EMA at 0.9431 exposed the pair to buying pressure. Therefore, the USD/CHF edged higher, from around multi-month lows below 0.9400, towards current price levels.

If USD/CHF buyers want to reclaim control, they would need a break above the top trendline of the channel, which also intersects with the 20-day EMA at 0.9549. Once cleared, that would pave the way towards the 100-day EMA at 0.9631, followed by the 50-day EMA at 0.9651.

On the other hand, if the major tumbles and closes below 0.9500, that could pave the way for further losses. Hence, the USD/CHF first support would be the August 16 low at 0.8445, followed by the 200-day EMA at 0.9431 and the monthly low at 0.9370.
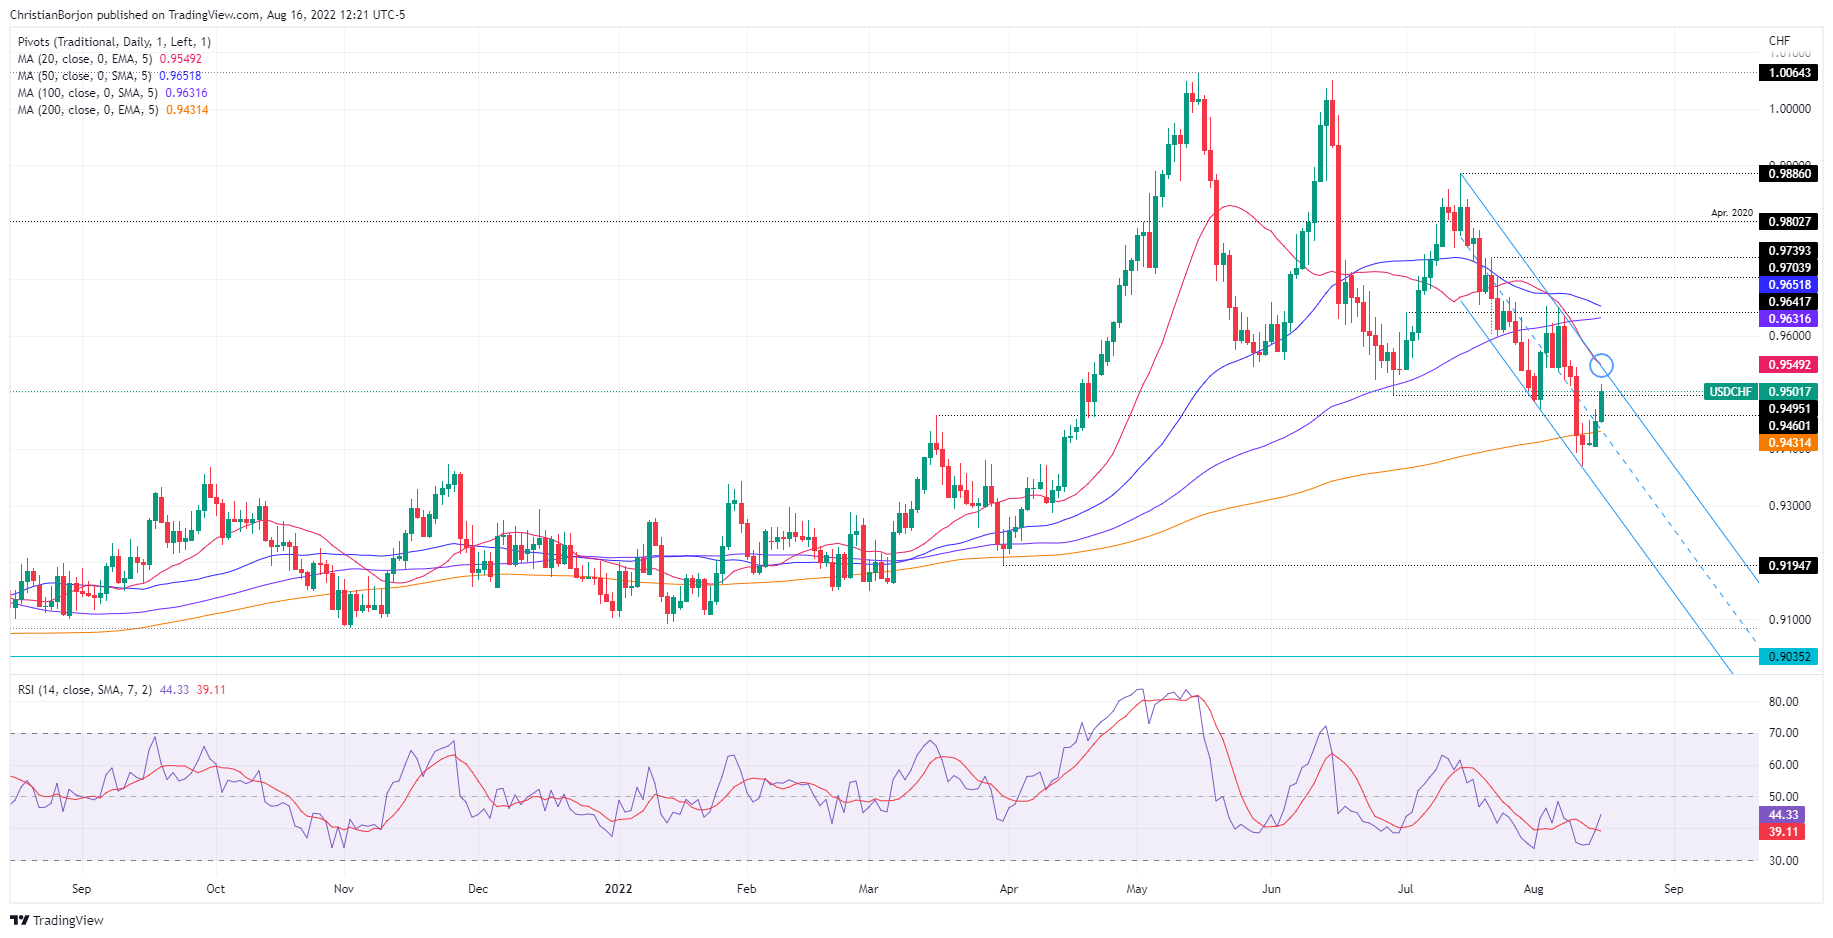

USD/CHF Daily chart

USD/CHF Key Technical Levels

USD/CHF

Overview
Today last price0.95
Today Daily Change0.0035
Today Daily Change %0.37
Today daily open0.9465
 
Trends
Daily SMA200.9565
Daily SMA500.9662
Daily SMA1000.9634
Daily SMA2000.9434
 
Levels
Previous Daily High0.9471
Previous Daily Low0.9409
Previous Weekly High0.9635
Previous Weekly Low0.9371
Previous Monthly High0.9886
Previous Monthly Low0.9502
Daily Fibonacci 38.2%0.9448
Daily Fibonacci 61.8%0.9433
Daily Pivot Point S10.9425
Daily Pivot Point S20.9386
Daily Pivot Point S30.9363
Daily Pivot Point R10.9488
Daily Pivot Point R20.9511
Daily Pivot Point R30.955

Author

Christian Borjon Valencia

Markets analyst, news editor, and trading instructor with over 14 years of experience across FX, commodities, US equity indices, and global macro markets.

More from Christian Borjon Valencia
Share:

Editor's Picks

EUR/USD flirts with weekly lows near 1.1770

EUR/USD now comes under further selling pressure, breaking below the 1.1800 support to challenge the area of weekly throughs near 1.1770 on Thursday. The pair’s decline comes in response to marked gains in the US Dollar amid steady geopolitical tensions. Ealier in the day, the ECB’s Lagarde delivered cautious remarks, although the currency remained apathetic.

GBP/USD threatens the 200-day SMA near 1.3440

GBP/USD rapidly leaves behind Wednesday’s strong advance, coming under heavy pressure and retesting the 1.3440 zone, where the critical 200-day SMA is located. Cable’s deep pullback follows the strong gains in the Greenback, while investors continue to pencil in a potential BoE rate cut in March.

Gold trims gains, slips back to around $5,170

Gold is now facing some downside pressure, hovering around the $5,170 region on Thursday. The yellow metal surrenders part of its earlier gains on the back of the resurgence of the buying interest in the Greenback. In the meantime, geopolitical tensions in the Middle East continue to limit the downside potential for now.

Stellar: Relief bounce fades as bearish undertone persists

Stellar is trading around $0.16 at the time of writing on Thursday after rebounding more than 8% in the previous day. Derivatives data paints a negative picture as XLM’s short bets hit a monthly high while Open Interest continues to decline.

Changing the game: International implications of recent tariff developments

The Supreme Court ruling on International Emergency Economic Powers Act (IEEPA) tariffs provides limited relief for the rest of the world, with weighted average tariff rates modestly lower.

Bitcoin steadies as traders eye US–Iran talks

Bitcoin (BTC) price is stabilizing around $68,000 at the time of writing on Thursday after a 6.2% relief rally the previous day amid a broader downward trend.