|

USD/CAD Technical Analysis: The drop to 1.3300 figure is virtually inevitable
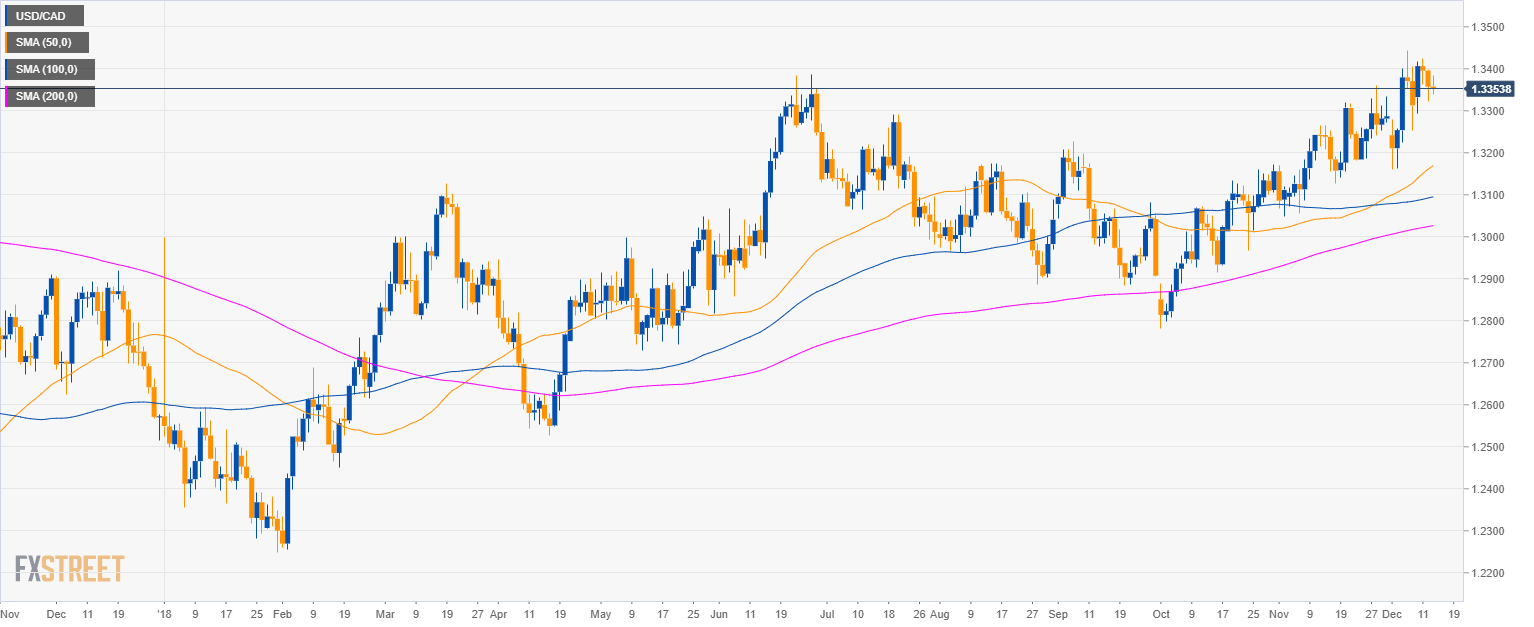
USD/CAD daily chart

  • USD/CAD is trading in a bull trend above the 50, 100 and 200-day simple moving averages.

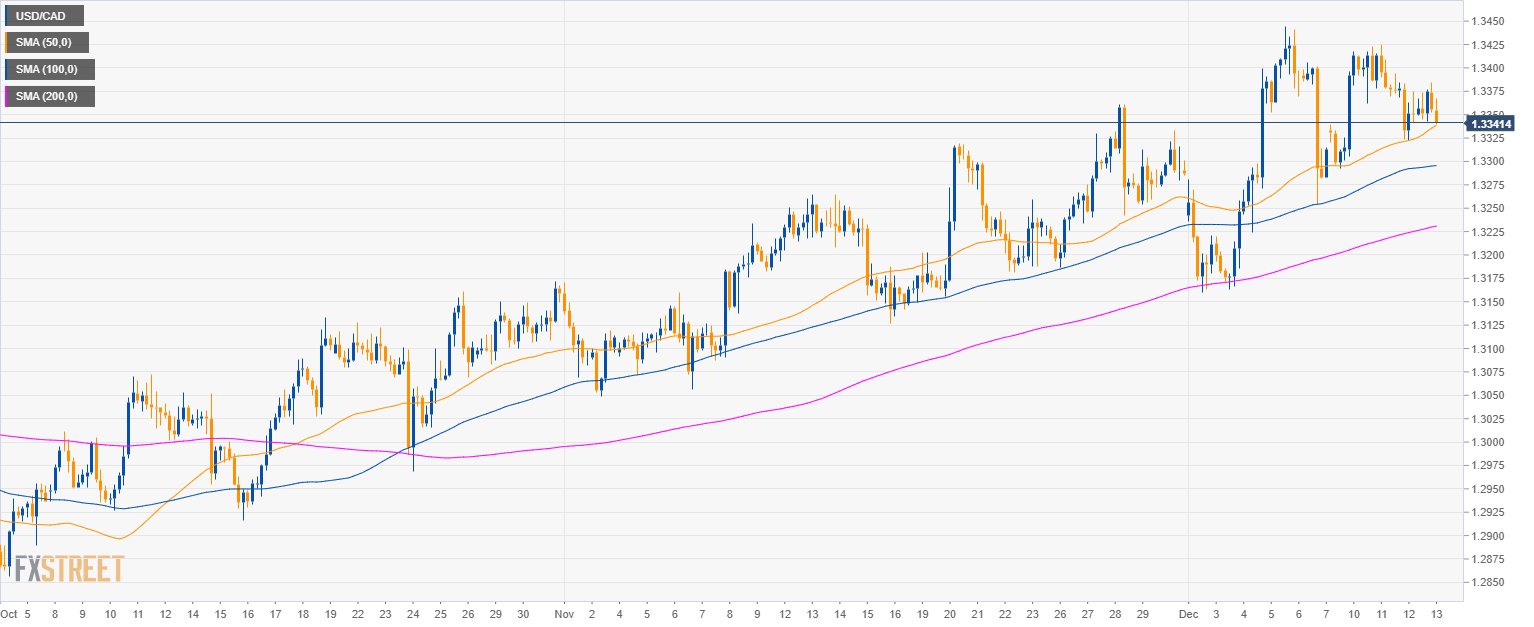
USD/CAD 4-hour chart

  • USD/CAD is testing the 50 SMA.

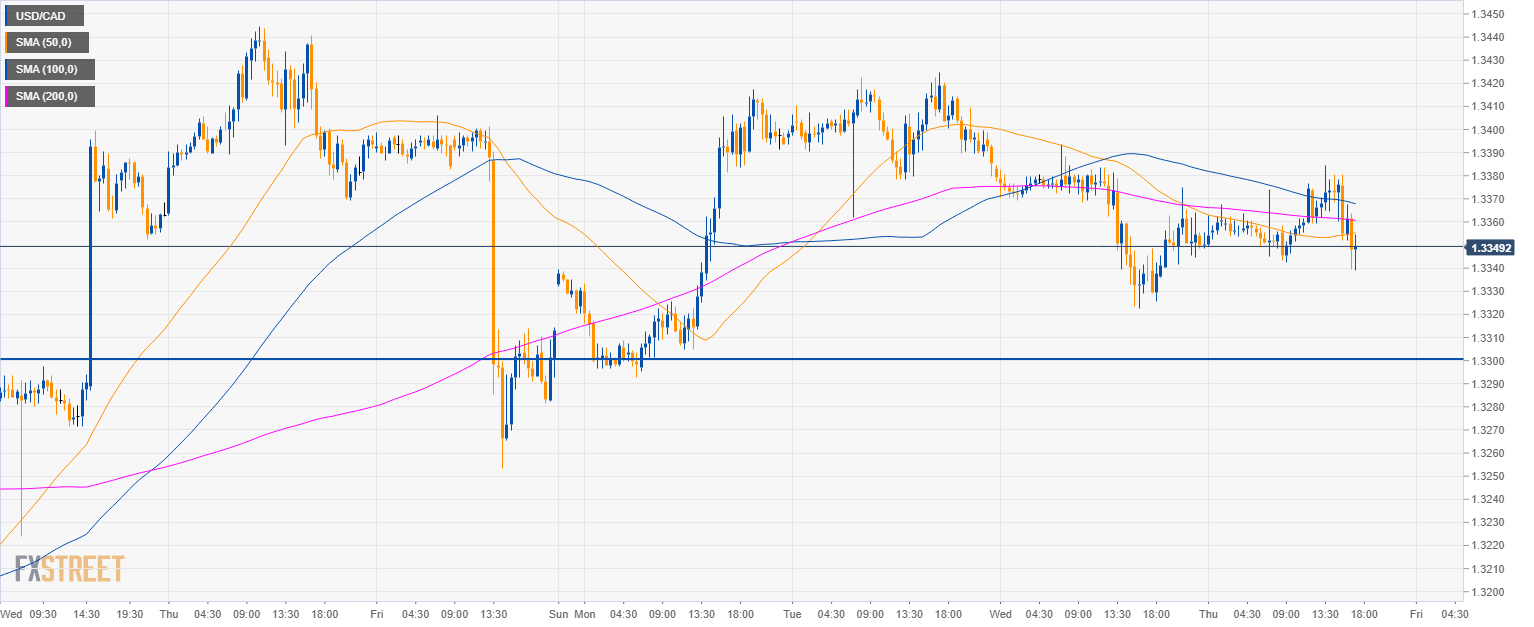
USD/CAD 30-minute chart

  • USD/CAD is trading below its main SMAs. 
  • Bears are in control and the next destination for them is likely going to be the 1.3300 figure to the downside.  

Additional key levels

USD/CAD

Overview:
    Today Last Price: 1.3341
    Today Daily change: -17 pips
    Today Daily change %: -0.127%
    Today Daily Open: 1.3358
Trends:
    Previous Daily SMA20: 1.3278
    Previous Daily SMA50: 1.3161
    Previous Daily SMA100: 1.3092
    Previous Daily SMA200: 1.3024
Levels:
    Previous Daily High: 1.34
    Previous Daily Low: 1.3322
    Previous Weekly High: 1.3445
    Previous Weekly Low: 1.316
    Previous Monthly High: 1.336
    Previous Monthly Low: 1.3048
    Previous Daily Fibonacci 38.2%: 1.3352
    Previous Daily Fibonacci 61.8%: 1.337
    Previous Daily Pivot Point S1: 1.332
    Previous Daily Pivot Point S2: 1.3283
    Previous Daily Pivot Point S3: 1.3243
    Previous Daily Pivot Point R1: 1.3397
    Previous Daily Pivot Point R2: 1.3437
    Previous Daily Pivot Point R3: 1.3474

Author

Flavio Tosti

Flavio Tosti

Independent Analyst


More from Flavio Tosti
Share:

Editor's Picks

EUR/USD holds lower ground near 1.1850 ahead of EU/ US data

EUR/USD remains in the negative territory for the fourth successive session, trading around 1.1850 in European trading on Friday. A broadly cautious market environment paired with modest US Dollar demand undermines the pair ahead of the Eurozone GDP second estimate and the critical US CPI data. 

GBP/USD keeps losses around 1.3600, awaits US CPI for fresh impetus

GBP/USD holds moderate losses at around 1.3600 in the European session on Friday, though it lacks bearish conviction. The US Dollar remains supported amid softer risk tone and ahead of the US consumer inflation figures due later in the NA session on Friday. 

Gold trims intraday gains to $5,000 as US inflation data loom

Gold retreats from the vicinity of the $5,000 psychological mark, though sticks to its modest intraday gains heading into the European session. Traders now look forward to the release of the US consumer inflation figures for more cues about the Fed policy path. The outlook will play a key role in influencing the near-term US Dollar price dynamics and provide some meaningful impetus to the non-yielding bullion.

US CPI data set to show modest inflation cooling as markets price in a more hawkish Fed

The US Bureau of Labor Statistics will publish January’s Consumer Price Index data on Friday, delayed by the brief and partial United States government shutdown. The report is expected to show that inflationary pressures eased modestly but also remained above the Federal Reserve’s 2% target.

A tale of two labour markets: Headline strength masks underlying weakness

Undoubtedly, yesterday’s delayed US January jobs report delivered a strong headline – one that surpassed most estimates. However, optimism quickly faded amid sobering benchmark revisions.

Solana Price Forecast: Mixed market sentiment caps recovery

Solana (SOL) is trading at $79 as of Friday, following a correction of over 9% so far this week. On-chain and derivatives data indicates mixed sentiment among traders, further limiting the chances of a price recovery.