|

USD/CAD Technical Analysis: Sidelined below 1.3300 figure awaiting next breakout
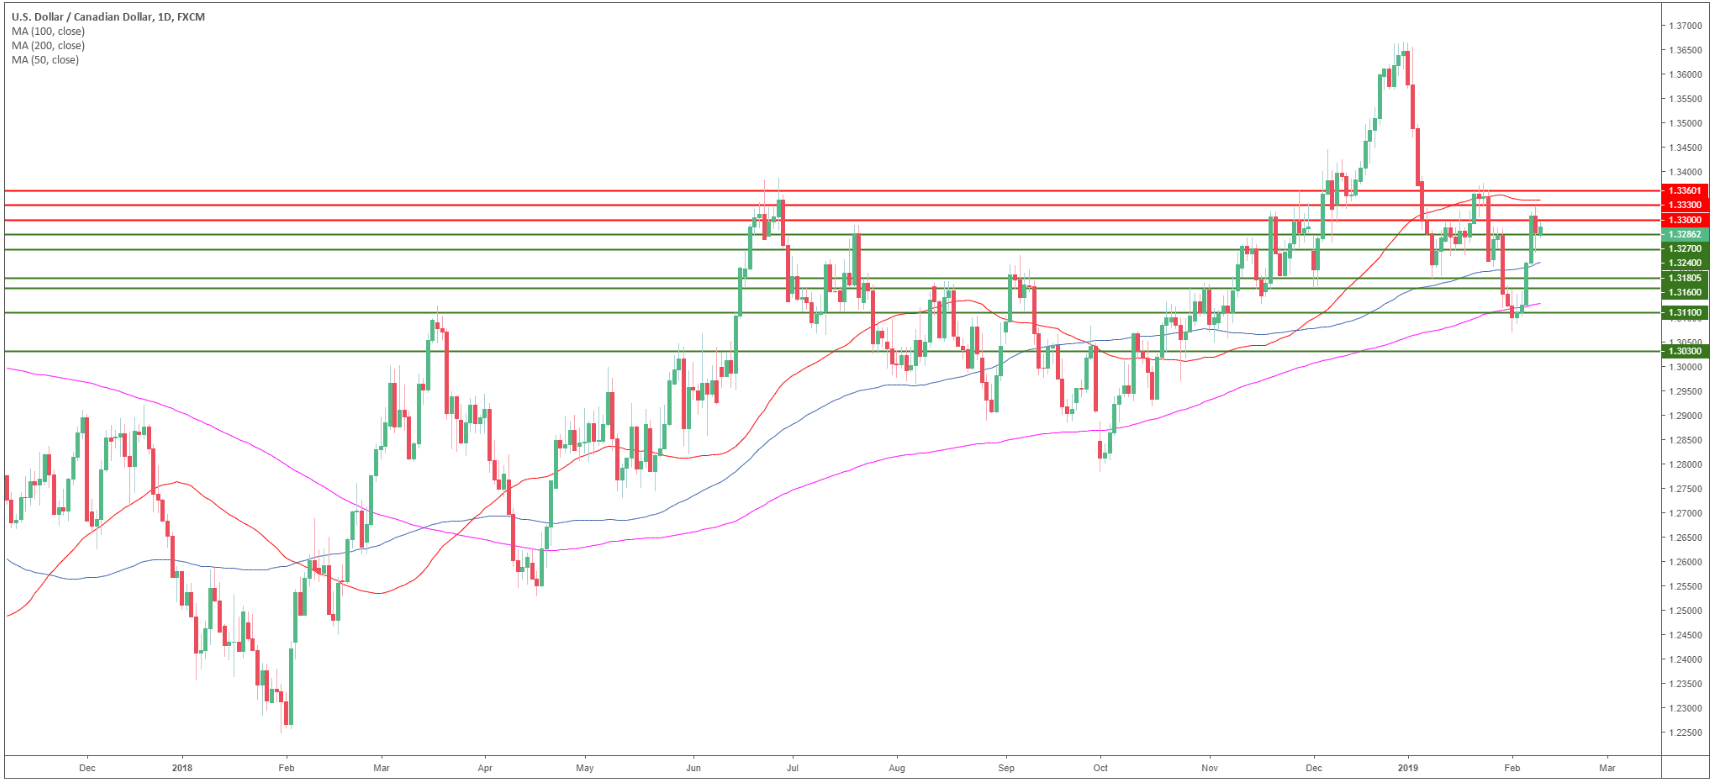
USD/CAD daily chart

  • USD/CAD is trading in a bull trend above the 200-day simple moving average (SMA). 

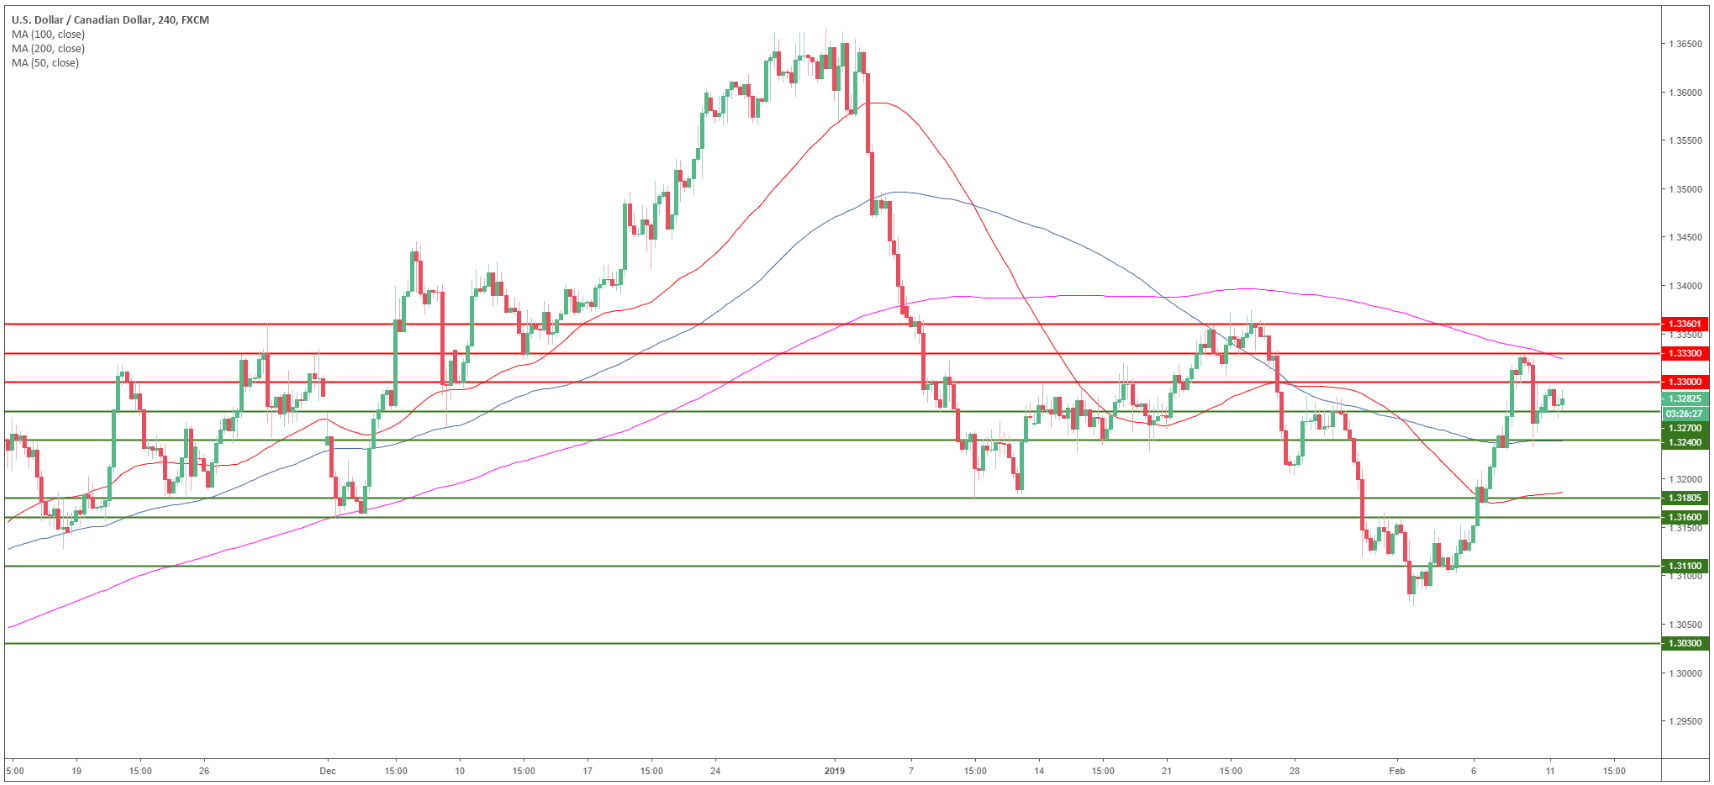
USD/CAD 4-hour chart

  • USD/CAD is trading between the 100 and 200 SMAs suggesting sideways trading in the medium-term.

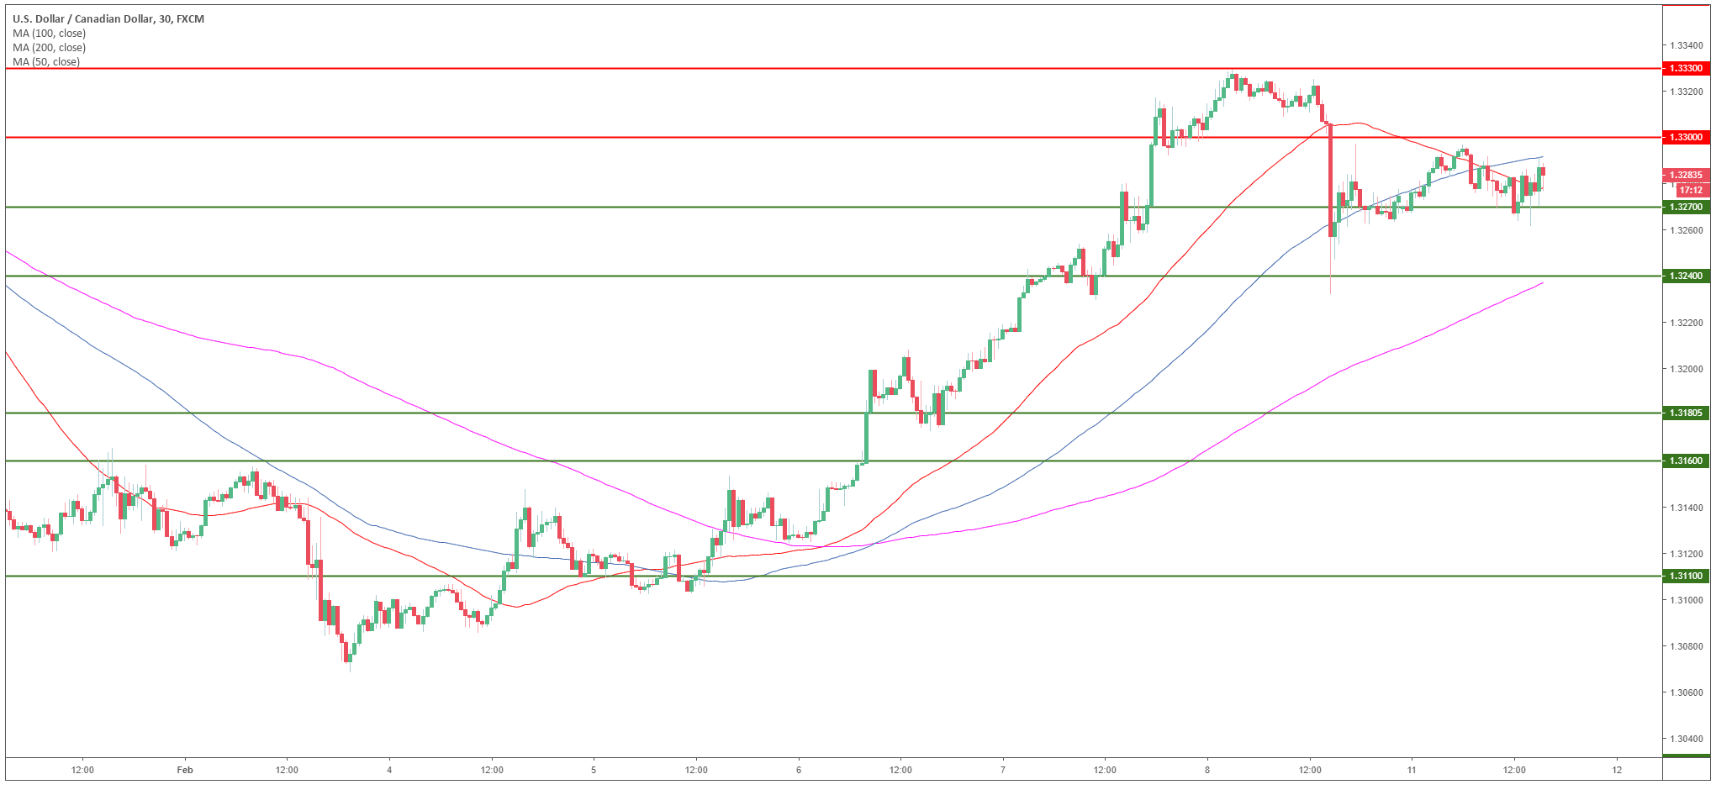
USD/CAD 30-minute chart

  • The 50 SMA crossed below the 100 SMA suggesting a slowdown in the current bullish momentum.
  • USD/CAD bulls need to overcome the 1.3300 figure in order to resume the bull trend. 
  • Bears need to break 1.3270 to reach 1.3240 and 1.3180 to the downside. As the 100 SMA is capping prices bears might be in control in the short-term

Additional key levels

USD/CAD

Overview:
    Today Last Price: 1.3287
    Today Daily change: 22 pips
    Today Daily change %: 0.17%
    Today Daily Open: 1.3265
Trends:
    Daily SMA20: 1.3242
    Daily SMA50: 1.3367
    Daily SMA100: 1.3231
    Daily SMA200: 1.3138
Levels:
    Previous Daily High: 1.333
    Previous Daily Low: 1.3232
    Previous Weekly High: 1.333
    Previous Weekly Low: 1.3084
    Previous Monthly High: 1.3664
    Previous Monthly Low: 1.3118
    Daily Fibonacci 38.2%: 1.327
    Daily Fibonacci 61.8%: 1.3293
    Daily Pivot Point S1: 1.3221
    Daily Pivot Point S2: 1.3177
    Daily Pivot Point S3: 1.3123
    Daily Pivot Point R1: 1.332
    Daily Pivot Point R2: 1.3374
    Daily Pivot Point R3: 1.3418

Author

Flavio Tosti

Flavio Tosti

Independent Analyst


More from Flavio Tosti
Share:

Editor's Picks

EUR/USD flirts with daily highs, retargets 1.1900

EUR/USD regains upside traction, returning to the 1.1880 zone and refocusing its attention to the key 1.1900 barrier. The pair’s slight gains comes against the backdrop of a humble decline in the US Dollar as investors continue to assess the latest US CPI readings and the potential Fed’s rate path.

GBP/USD remains well bid around 1.3650

GBP/USD maintains its upside momentum in place, hovering around daily highs near 1.3650 and setting aside part of the recent three-day drop. Cable’s improved sentiment comes on the back of the Greenback’s  irresolute price action, while recent hawkish comments from the BoE’s Pill also collaborate with the uptick.

Gold clings to gains just above $5,000/oz

Gold is reclaiming part of the ground lost on Wednesday’s marked decline, as bargain-hunters keep piling up and lifting prices past the key $5,000 per troy ounce. The precious metal’s move higher is also underpinned by the slight pullback in the US Dollar and declining US Treasury yields across the curve.

Crypto Today: Bitcoin, Ethereum, XRP in choppy price action, weighed down by falling institutional interest 

Bitcoin's upside remains largely constrained amid weak technicals and declining institutional interest. Ethereum trades sideways above $1,900 support with the upside capped below $2,000 amid ETF outflows.

Week ahead – Data blitz, Fed Minutes and RBNZ decision in the spotlight

US GDP and PCE inflation are main highlights, plus the Fed minutes. UK and Japan have busy calendars too with focus on CPI. Flash PMIs for February will also be doing the rounds. RBNZ meets, is unlikely to follow RBA’s hawkish path.

Ripple Price Forecast: XRP potential bottom could be in sight

Ripple edges up above the intraday low of $1.35 at the time of writing on Friday amid mixed price actions across the crypto market. The remittance token failed to hold support at $1.40 the previous day, reflecting risk-off sentiment amid a decline in retail and institutional sentiment.