USD/CAD Technical Analysis: Greenback rises to 6-month’s high post-Bank of Canada

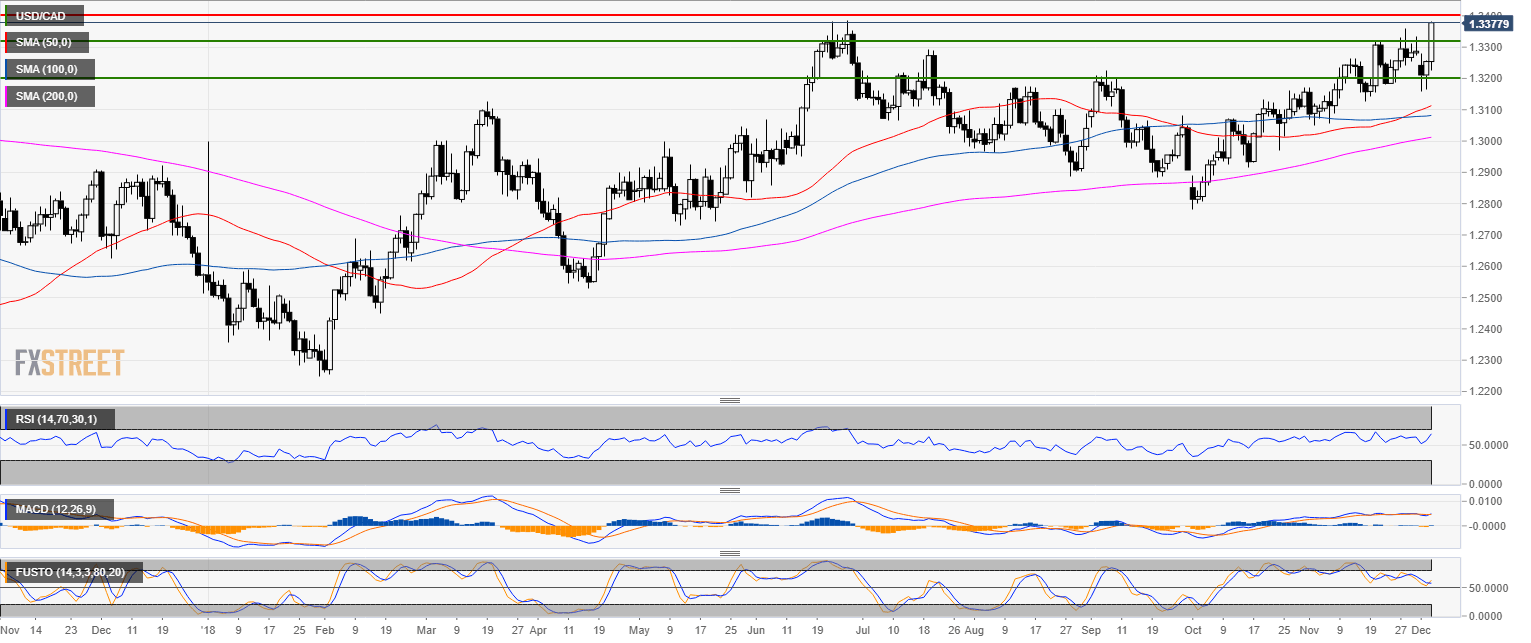
USD/CAD daily chart
- USD/CAD is trading in a bull trend above the 200-day simple moving average (SMA).
- USD/CAD spiked up as the Bank of Canada keeps the policy rate unchanged at 1.75%.
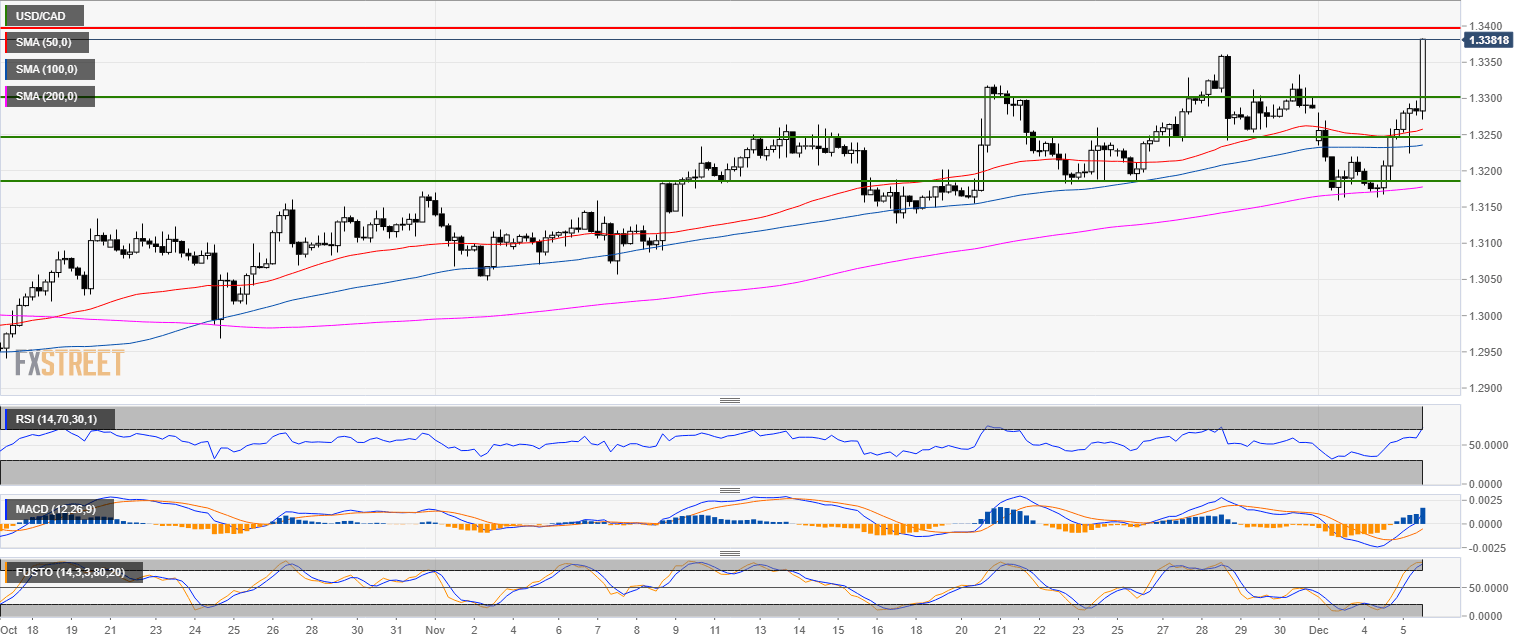
USD/CAD 4-hour chart
- Bulls broke above the 1.3300 figure as the next target is the 1.3400 level.
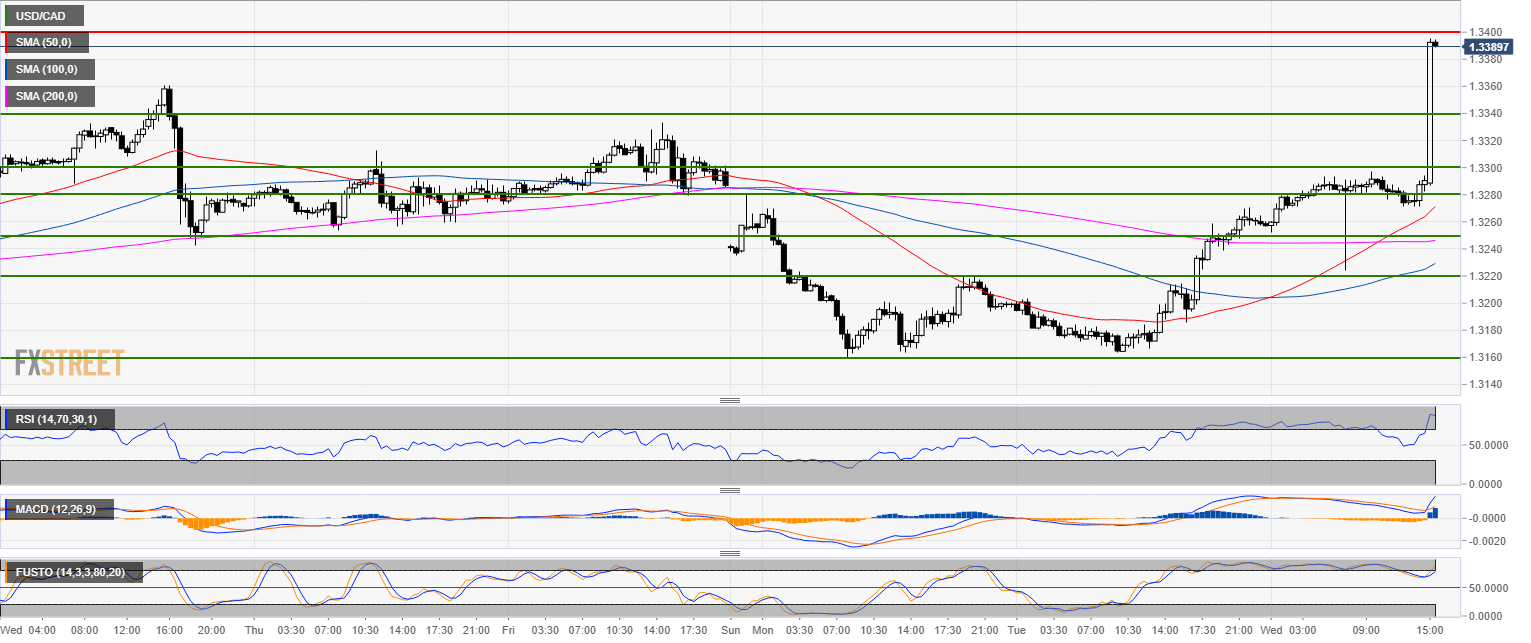
USD/CAD 30-minute chart
- The level to beat for bulls is 1.3400 figure.
Additional key levels
USD/CAD
Overview:
Today Last Price: 1.3392
Today Daily change: 1.4e+2 pips
Today Daily change %: 1.04%
Today Daily Open: 1.3254
Trends:
Previous Daily SMA20: 1.3227
Previous Daily SMA50: 1.3106
Previous Daily SMA100: 1.308
Previous Daily SMA200: 1.3006
Levels:
Previous Daily High: 1.3258
Previous Daily Low: 1.3164
Previous Weekly High: 1.336
Previous Weekly Low: 1.3187
Previous Monthly High: 1.336
Previous Monthly Low: 1.3048
Previous Daily Fibonacci 38.2%: 1.3222
Previous Daily Fibonacci 61.8%: 1.32
Previous Daily Pivot Point S1: 1.3192
Previous Daily Pivot Point S2: 1.313
Previous Daily Pivot Point S3: 1.3097
Previous Daily Pivot Point R1: 1.3287
Previous Daily Pivot Point R2: 1.332
Previous Daily Pivot Point R3: 1.3382
Author

Flavio Tosti
Independent Analyst


