- USD/CAD remains bullish above its 200-day simple moving average (DSMA).
- The level to beat for bulls is 1.3400 which is a cluster of many technical levels.
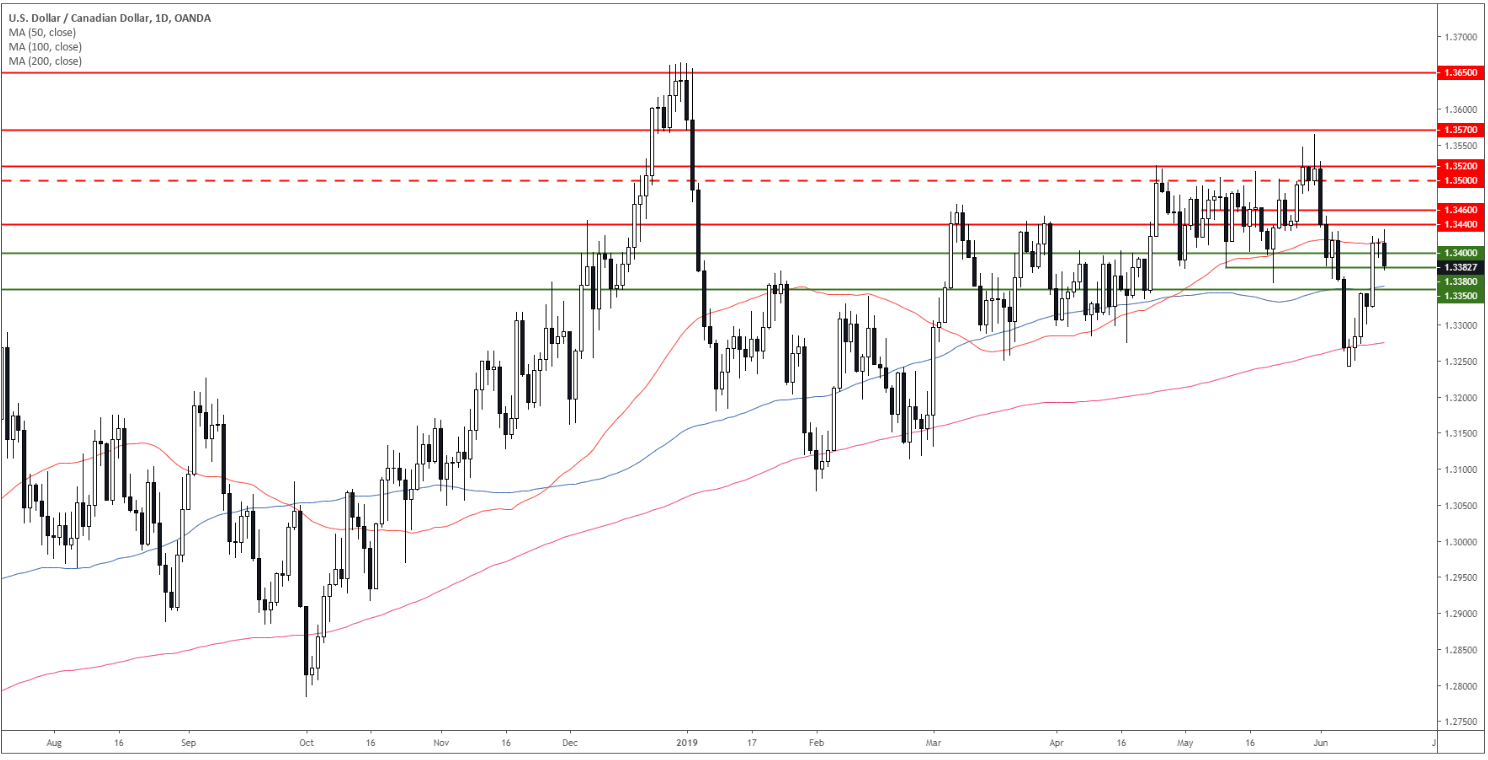
USD/CAD daily chart
USD/CAD is in a bull trend above its 100 and 200-day simple moving average (DSMA). The market found some resistance at 1.3440 and the 50 SMA.
USD/CAD 4-hour chart
USD/CAD is currently rejecting the 1.3400 figure and the 100/200 SMAs. There is strong support at 1.3350, the 100 SMA on the daily chart and the weekly Fibonacci of 38.2%.
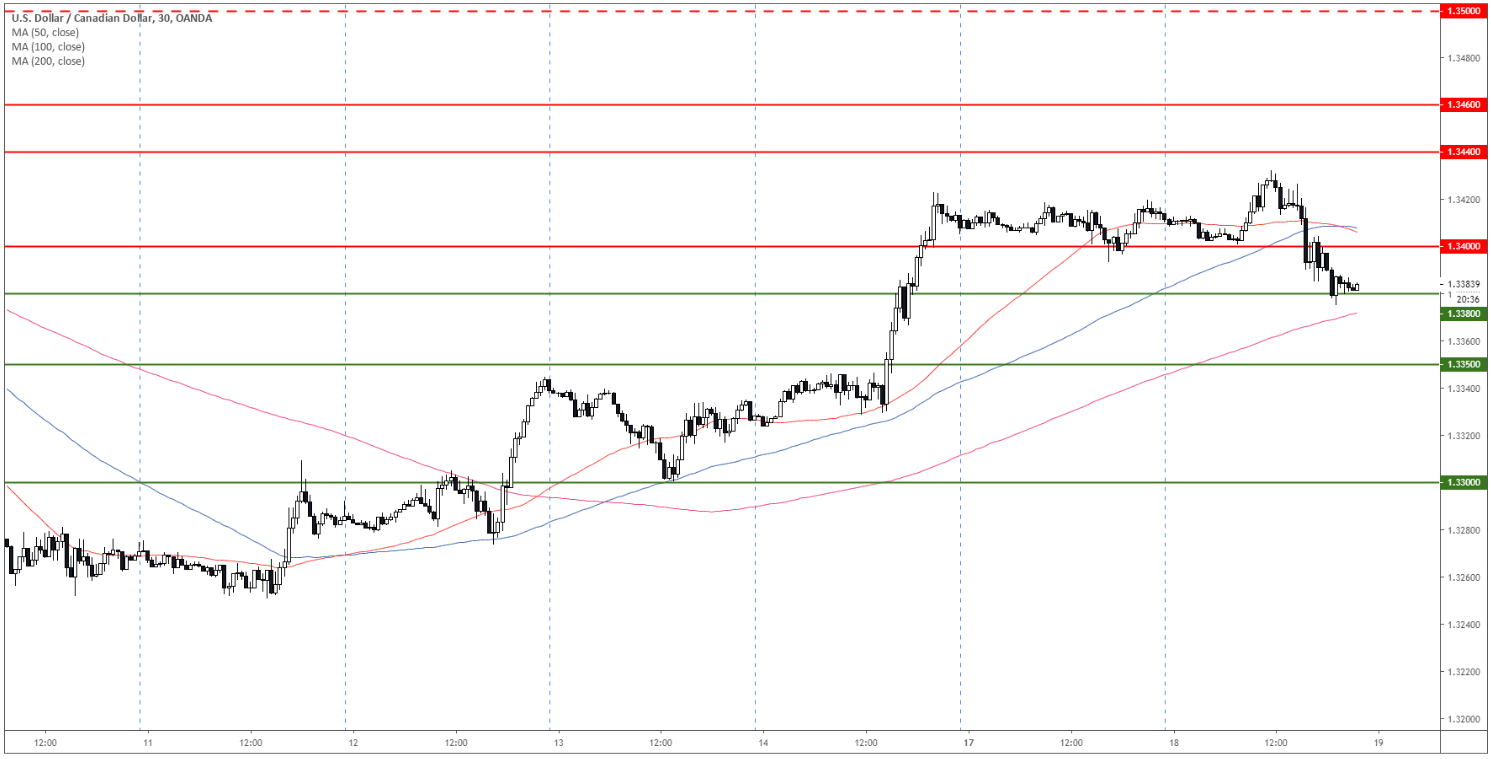
USD/CAD 30-minute chart
The 50 SMA is crossing below the 100 SMA suggesting that the market is losing some bullish momentum in the near term. A break below 1.3380 weak support (weekly Fibonacci of 23.6%) can lead to a drop to 1.3350. On the flip side, resistance is at 1.3400 figure, this level is a cluster of several technical indicators according to the Technical Confluences Indicator. If broken the market could potentially break sharply up towards 1.3500 figure.
Additional key levels
Note: All information on this page is subject to change. The use of this website constitutes acceptance of our user agreement. Please read our privacy policy and legal disclaimer. Opinions expressed at FXstreet.com are those of the individual authors and do not necessarily represent the opinion of FXstreet.com or its management. Risk Disclosure: Trading foreign exchange on margin carries a high level of risk, and may not be suitable for all investors. The high degree of leverage can work against you as well as for you. Before deciding to invest in foreign exchange you should carefully consider your investment objectives, level of experience, and risk appetite. The possibility exists that you could sustain a loss of some or all of your initial investment and therefore you should not invest money that you cannot afford to lose. You should be aware of all the risks associated with foreign exchange trading, and seek advice from an independent financial advisor if you have any doubts.
Recommended content
Editors’ Picks
EUR/USD steady below 1.0800 after US PCE meets expectations
EUR/USD remains depressed below 1.0800 after soft French inflation data, amid minimal volatility and thin liquidity on Good Friday. The pair barely reacted to US PCE inflation data, with the Greenback shedding some pips. Fed Chair Jerome Powell set to speak ahead of the weekly close.
GBP/USD hovers around 1.2620 in dull trading
GBP/USD trades sideways above 1.2600 amid a widespread holiday restraining action across financial markets. Investors took a long weekend ahead of critical United States employment data next week. Fed Chair Powell coming up next.
Gold price sits at all-time highs above $2,230
Gold price holds near a fresh all-time high at $2,236 in thinned trading amid the Easter Holiday. Most major world markets remain closed, although the United States published core PCE inflation, the Federal Reserve’s favorite inflation gauge.
Jito price could hit $6 as JTO coils up inside this bullish pattern
Jito (JTO) price has been on an uptrend since forming a local bottom in early January. Since then, JTO has revisited the key swing point formed in early December, suggesting the bulls’ intention to move higher.
Key events in developed markets next week
Next week, the main focus will be inflation and the labour market in the Eurozone. We expect services inflation to be impacted by the easter effect, while the unemployment rate to be unchanged.