|

USD/CAD Technical Analysis: Greenback bears eyeing 1.3200 figure against CAD
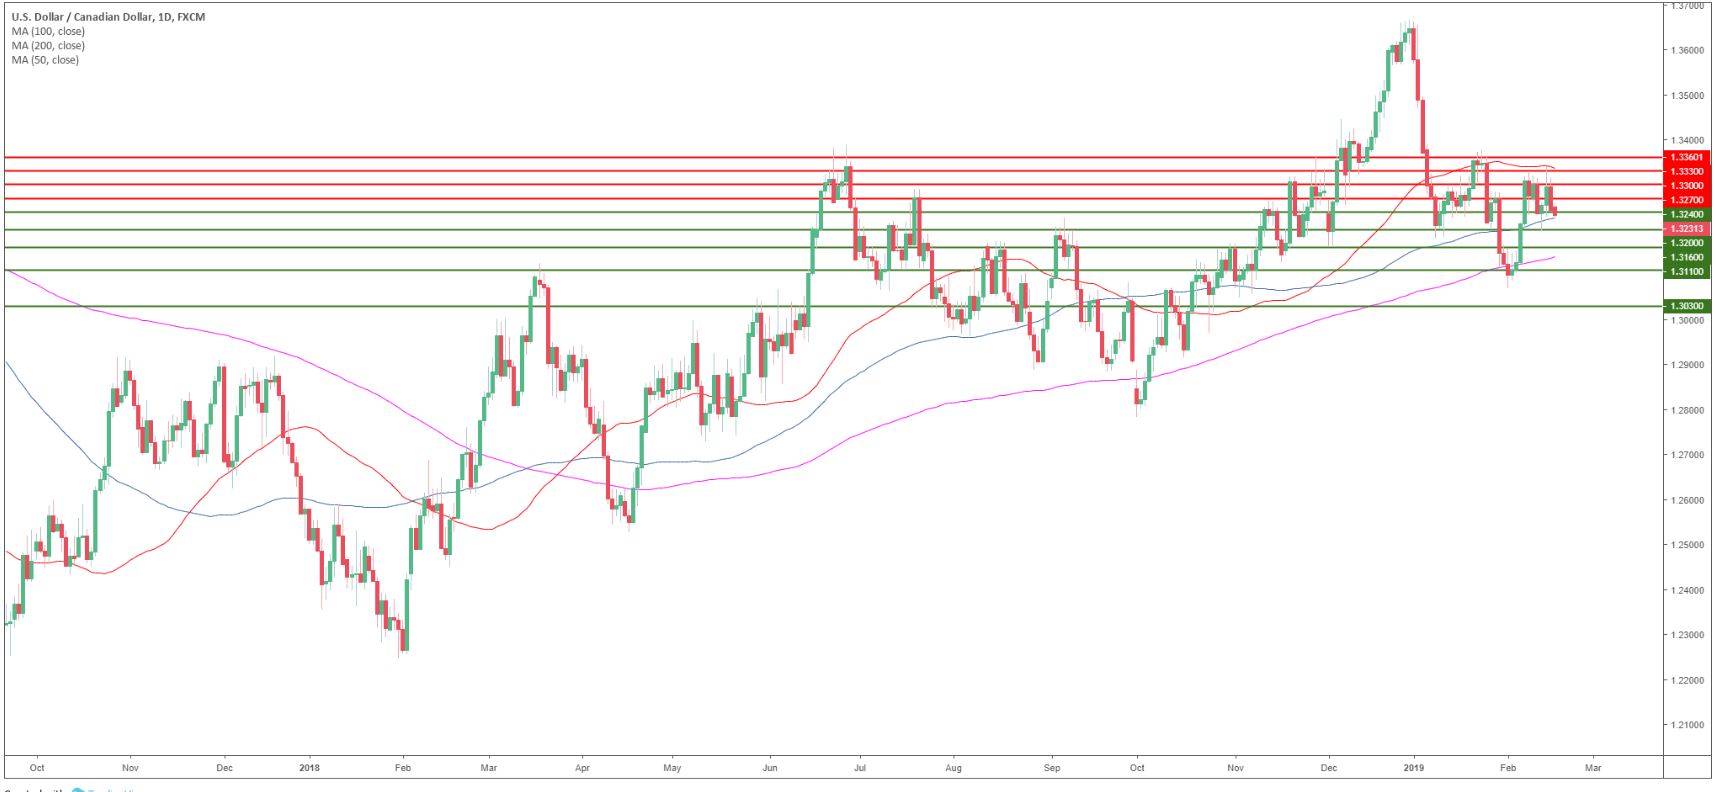
USD/CAD daily chart

  • On the daily time-frame, USD/CAD is trading between the 50 and the 100-day simple moving averages (SMAs) suggesting a sideways market.
  • This Monday, US President’s Day, might offer limited moves in the financial markets.

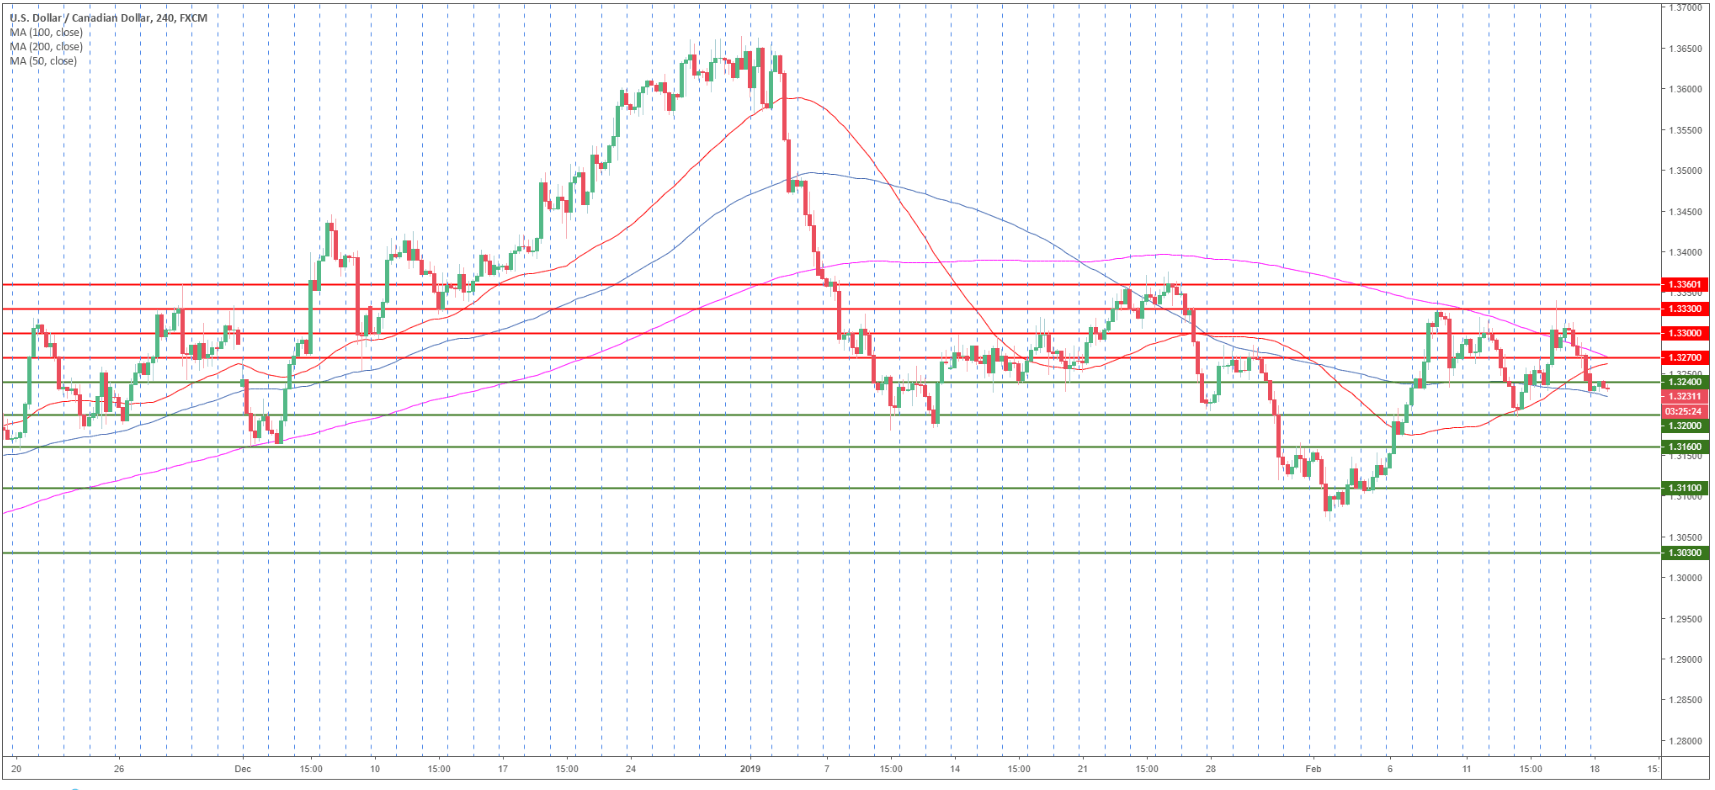
USD/CAD 4-hour chart

  • USD/CAD is trading between the 100 and 200 SMAs suggesting bearish momentum in the medium-term.

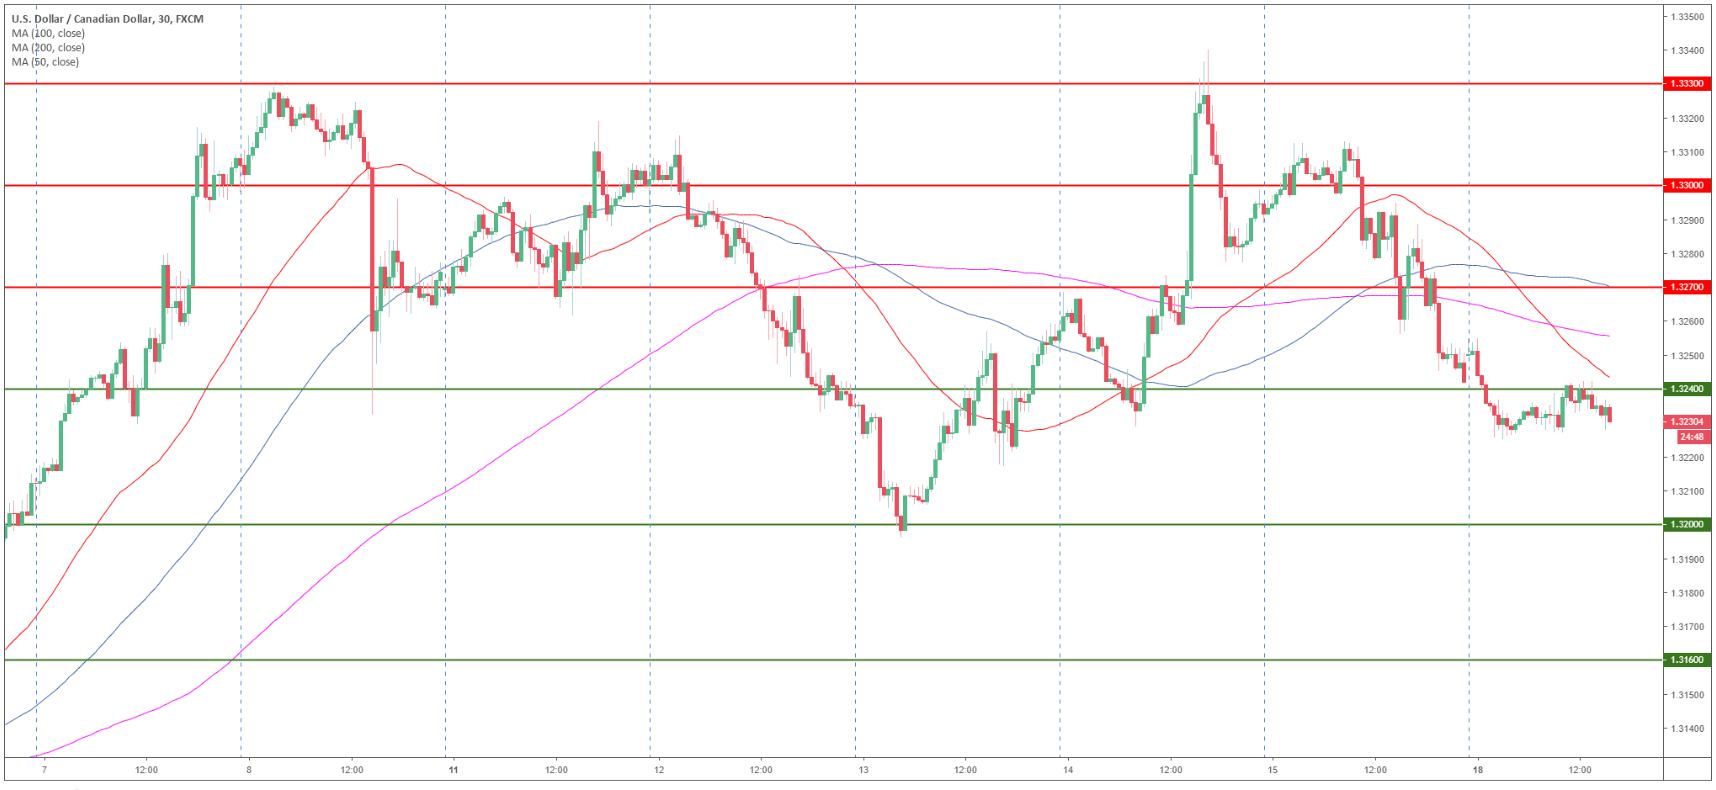
USD/CAD 30-minute chart

  • USD/CAD is trading below its main SMAs suggesting a bear market in the short-term.
  • Bears will likely try to reach 1.3200 figure to the downside.
  • Resistance is seen at 1.3240 and 1.3270 level.

Additional key levels

USD/CAD

Overview:
    Today Last Price: 1.3235
    Today Daily change: -12 pips
    Today Daily change %: -0.09%
    Today Daily Open: 1.3247
Trends:
    Daily SMA20: 1.3241
    Daily SMA50: 1.3363
    Daily SMA100: 1.3245
    Daily SMA200: 1.3148
Levels:
    Previous Daily High: 1.3314
    Previous Daily Low: 1.3245
    Previous Weekly High: 1.3341
    Previous Weekly Low: 1.3196
    Previous Monthly High: 1.3664
    Previous Monthly Low: 1.3118
    Daily Fibonacci 38.2%: 1.3272
    Daily Fibonacci 61.8%: 1.3288
    Daily Pivot Point S1: 1.3223
    Daily Pivot Point S2: 1.32
    Daily Pivot Point S3: 1.3154
    Daily Pivot Point R1: 1.3292
    Daily Pivot Point R2: 1.3338
    Daily Pivot Point R3: 1.3362

Author

Flavio Tosti

Flavio Tosti

Independent Analyst


More from Flavio Tosti
Share:

Editor's Picks

EUR/USD holds steady above 1.1850 in quiet session

EUR/USD stays defensive but holds 1.1850 amid quiet markets in the European hours on Monday.  The US Dollar is struggling for direction due to thin liquidity conditions as US markets are closed in observance of Presidents' Day holiday. 

GBP/USD flat lines near 1.3650 ahead of UK and US data

GBP/USD kicks off a new week on a subdued note and oscillates in a narrow range near 1.3650 on Monday. The mixed fundamental backdrop warrants some caution for aggressive traders as the market focus now shifts to this week's important data releases from the UK and the US.

Gold corrects lower, tries to stabilize above $5,000

Gold started the week under bearish pressure and declined to the $4,960 area before staging a modest rebound. As trading volumes remain thin with the US financial markets remaining closed on Presidents' Day holiday, XAU/USD looks to stabilize above $5,000 ahead of this week's key data releases.

Bitcoin consolidates as on-chain data show mixed signals

Bitcoin price has consolidated between $65,700 and $72,000 over the past nine days, with no clear directional bias. US-listed spot ETFs recorded a $359.91 million weekly outflow, marking the fourth consecutive week of withdrawals.

The week ahead: Key inflation readings and why the AI trade could be overdone

It is likely to be a quiet start to the week, with US markets closed on Monday for Presidents Day. European markets are higher across the board and gold is clinging to the $5,000 level after the tamer than expected CPI report in the US reduced haven flows to precious metals.

Monero Price Forecast: XMR risks a drop below $300 under mounting bearish pressure

Monero (XMR) starts the week under pressure, recording a 4% decline at press time on Monday after a 7% drop the previous day, putting the $300 support zone in focus.