USD/CAD Technical Analysis: Greenback at 2-week lows ahead of FOMC Minutes

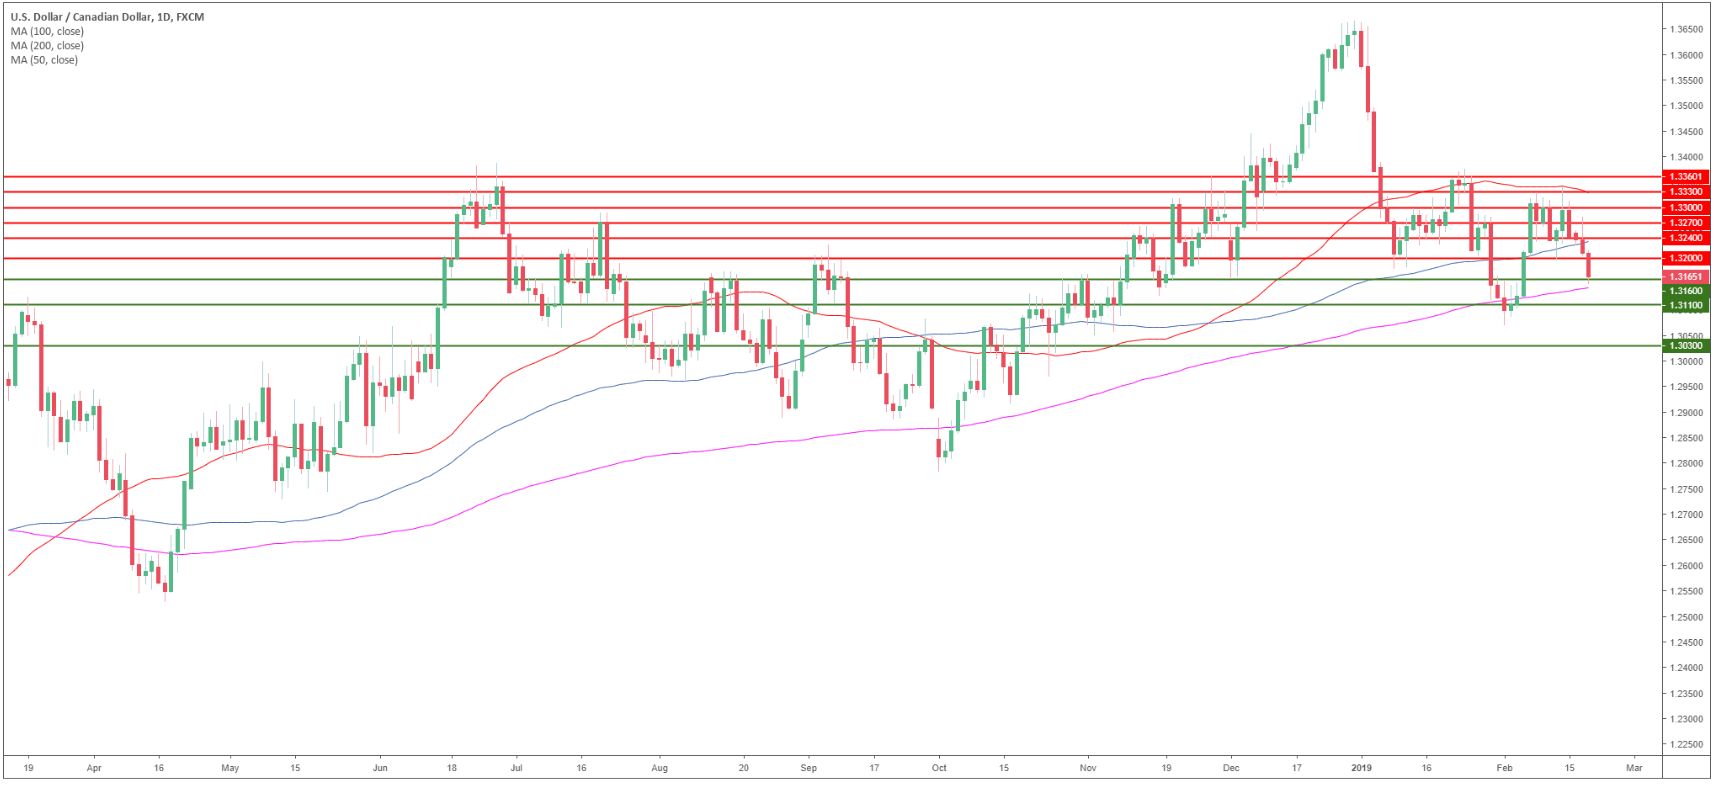
USD/CAD daily chart
- On the daily time-frame, USD/CAD is trading between the 100 and the 200-day simple moving averages.
- The FOMC Minutes at 19.00 GMT can potentially lead to high volatility in the financial markets and in USD-related pairs.
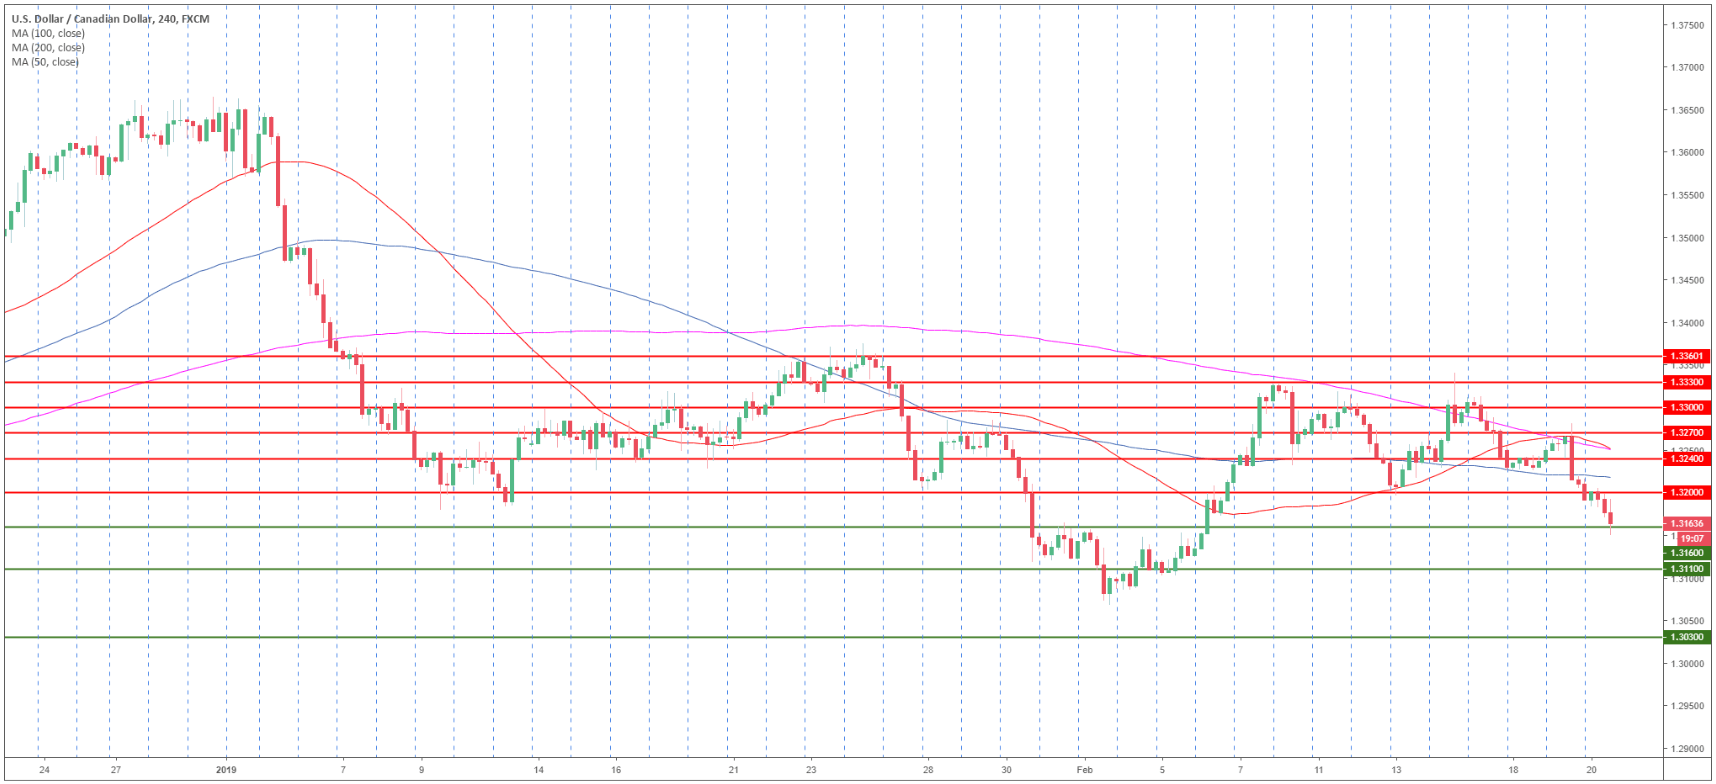
USD/CAD 4-hour chart
- USD/CAD is trading below the main SMAs suggesting bearish momentum in the medium-term.
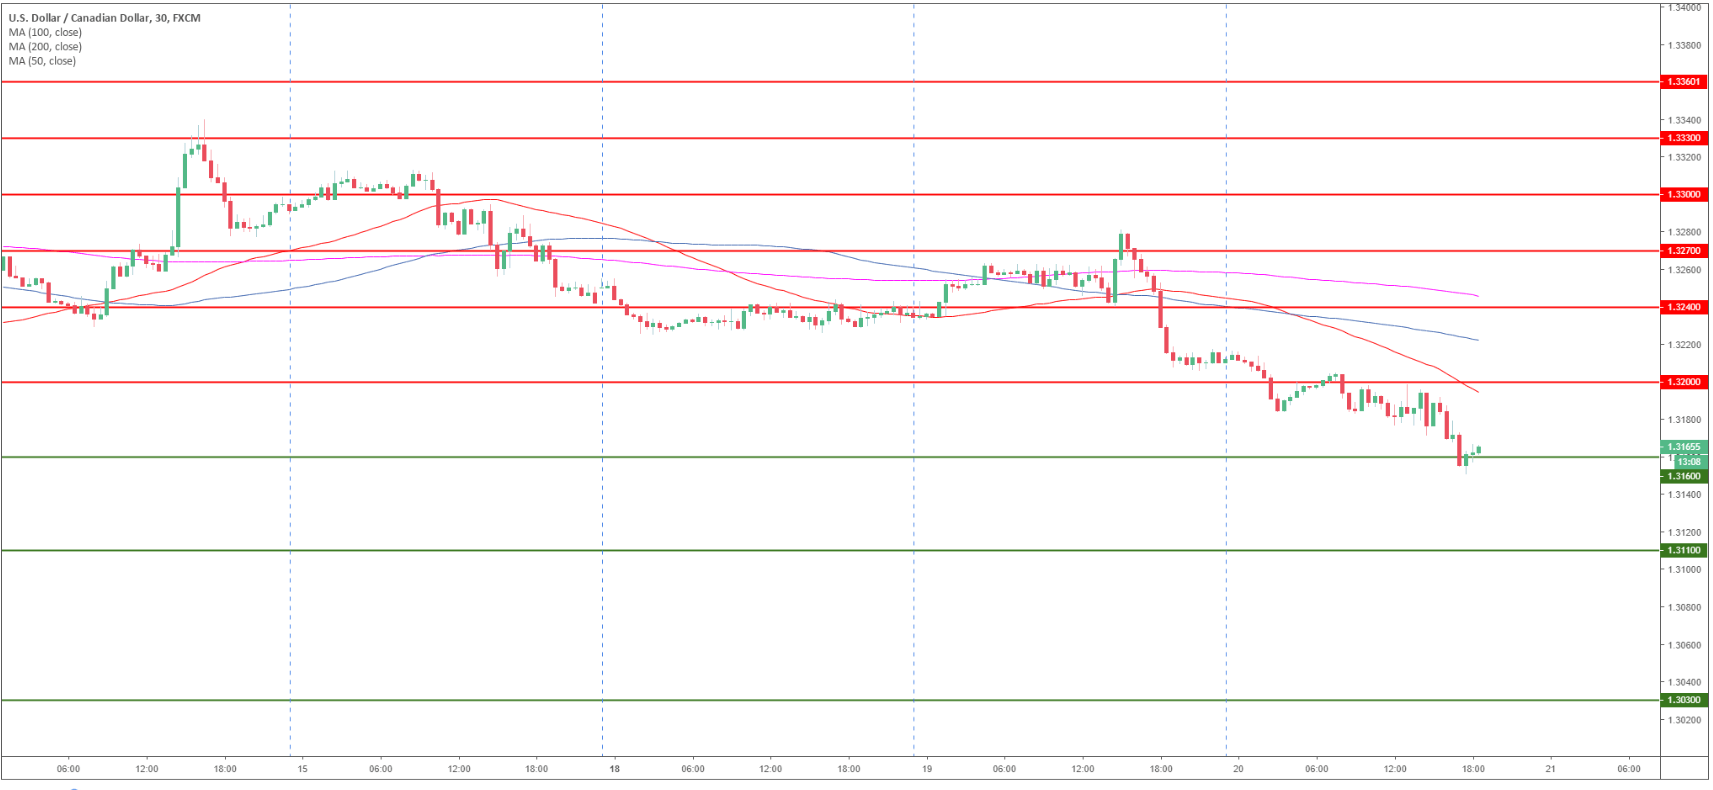
USD/CAD 30-minute chart
- USD/CAD is trading below its main SMAs suggesting a bear market in the short-term.
- A break below 1.3160 support should lead to 1.3110 to the downside.
- Resistance is seen at 1.3200 and 1.3240 level.
Additional key levels
USD/CAD
Overview:
Today Last Price: 1.3166
Today Daily change: -46 pips
Today Daily change %: -0.35%
Today Daily Open: 1.3212
Trends:
Daily SMA20: 1.3231
Daily SMA50: 1.3356
Daily SMA100: 1.3253
Daily SMA200: 1.3152
Levels:
Previous Daily High: 1.3294
Previous Daily Low: 1.3204
Previous Weekly High: 1.3341
Previous Weekly Low: 1.3196
Previous Monthly High: 1.3664
Previous Monthly Low: 1.3118
Daily Fibonacci 38.2%: 1.3239
Daily Fibonacci 61.8%: 1.326
Daily Pivot Point S1: 1.3179
Daily Pivot Point S2: 1.3147
Daily Pivot Point S3: 1.3089
Daily Pivot Point R1: 1.3269
Daily Pivot Point R2: 1.3327
Daily Pivot Point R3: 1.3359
Author

Flavio Tosti
Independent Analyst


