USD/CAD Technical Analysis: Bearish target achieved as Greenback collapses below 1.3300 figure on strong Canadian jobs data

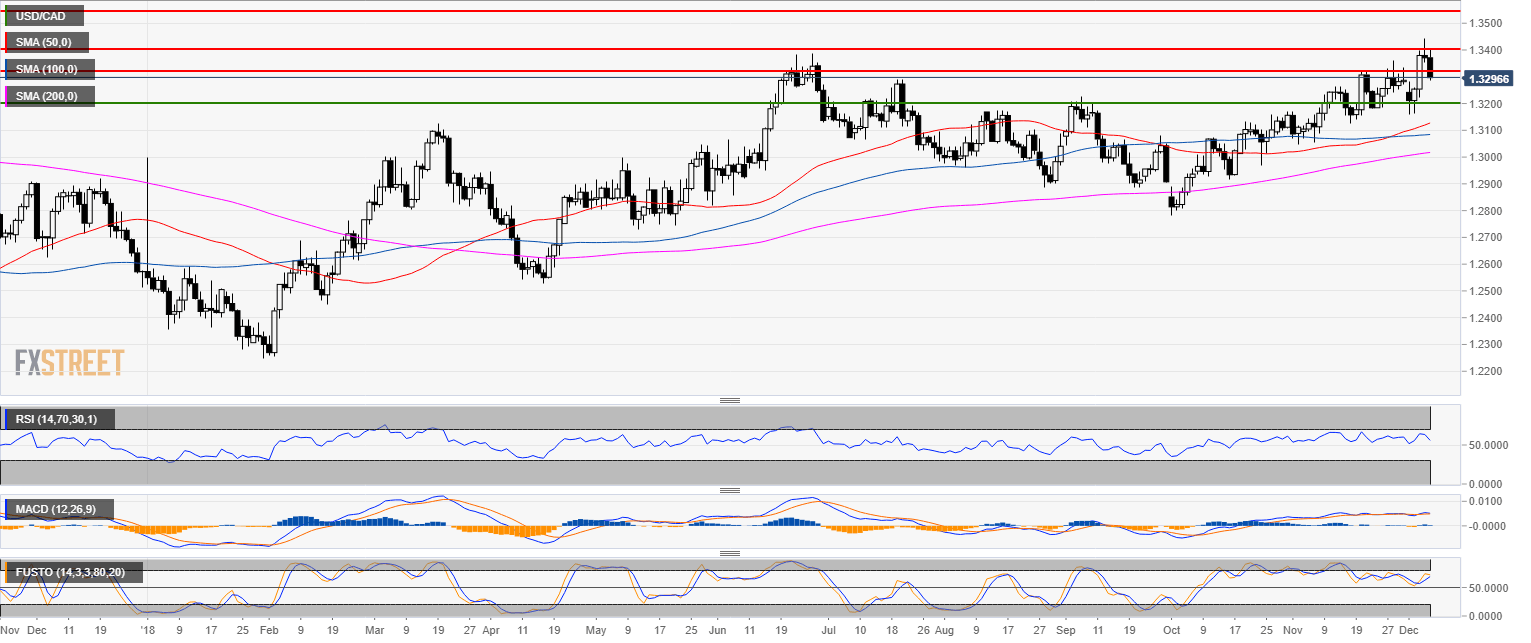
USD/CAD daily chart
- USD/CAD is trading in a bull trend above the 200-day simple moving average (SMA).
- As forecast, the bearish target at 1.3340 has been achieved.
- 94.1K new Canadian jobs in November along with surging oil prices and a disappointing US Nonfarm Payrolls was the perfect storm for a selloff on USD/CAD.
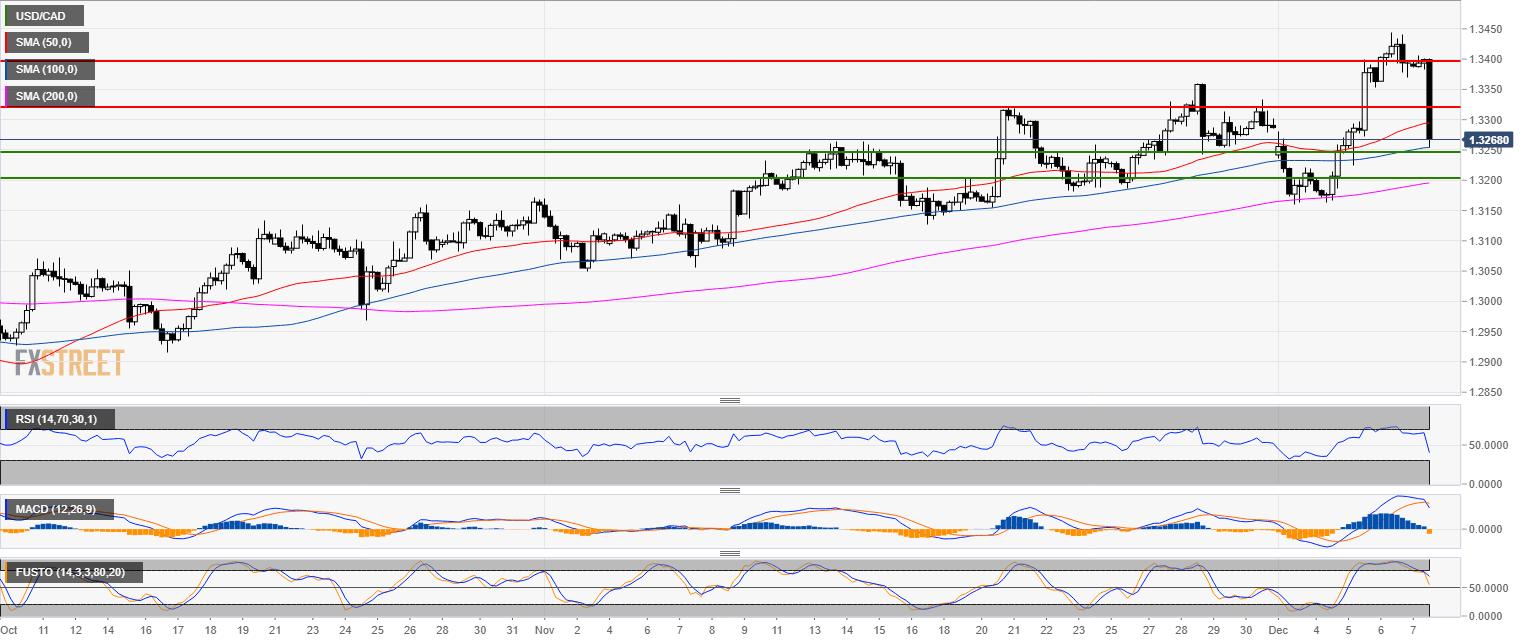
USD/CAD 4-hour chart
- USD/CAD is now testing the 100 SMA and 1.3260 support.
- The bears made a lot of damage and the market might need to correct to the 1.3200 figure.
- Technical indicators have turned bearish.
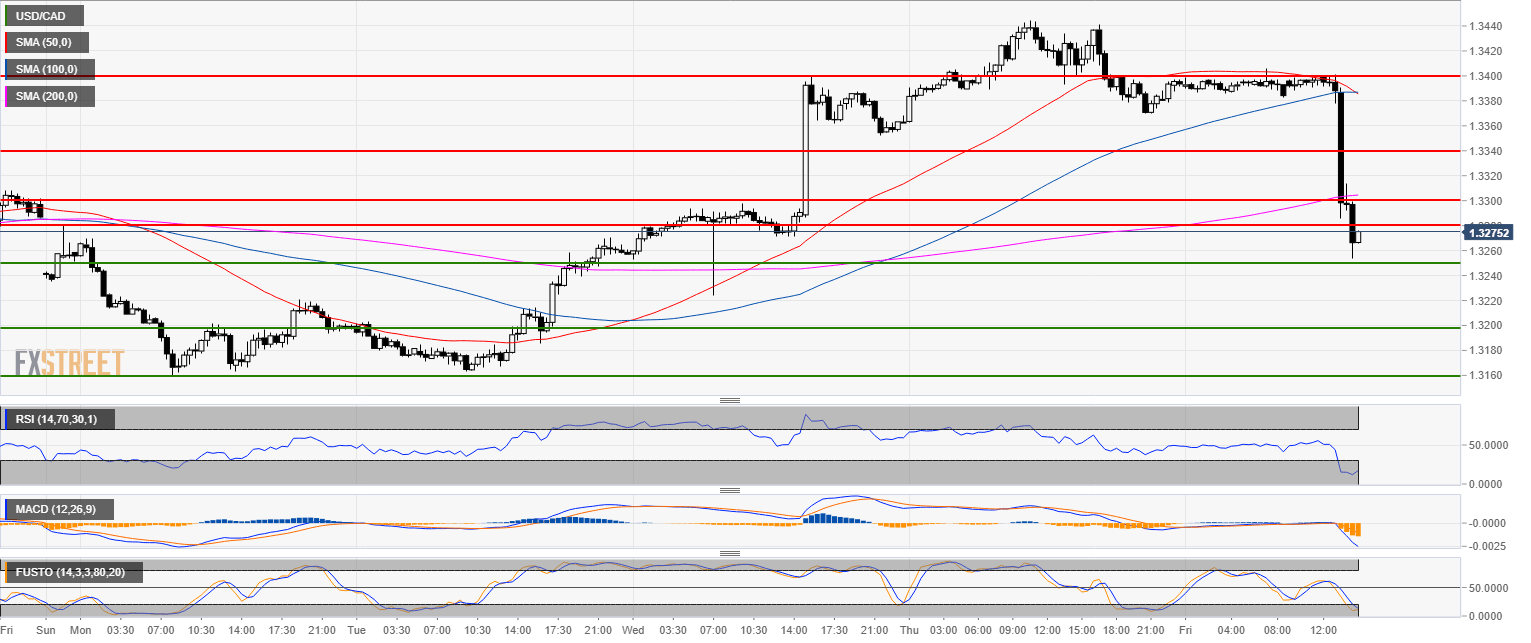
USD/CAD 30-minute chart
- USD/CAD broke below the 200 SMA.
- There seems to be little hope for a strong bullish recovery suggesting further weakness towards 1.3200 figure in the coming sessions.
Additional key levels
USD/CAD
Overview:
Today Last Price: 1.3266
Today Daily change: -1.0e+2 pips
Today Daily change %: -0.785%
Today Daily Open: 1.3371
Trends:
Previous Daily SMA20: 1.3251
Previous Daily SMA50: 1.312
Previous Daily SMA100: 1.3084
Previous Daily SMA200: 1.3013
Levels:
Previous Daily High: 1.3445
Previous Daily Low: 1.3352
Previous Weekly High: 1.336
Previous Weekly Low: 1.3187
Previous Monthly High: 1.336
Previous Monthly Low: 1.3048
Previous Daily Fibonacci 38.2%: 1.3388
Previous Daily Fibonacci 61.8%: 1.341
Previous Daily Pivot Point S1: 1.3334
Previous Daily Pivot Point S2: 1.3297
Previous Daily Pivot Point S3: 1.3242
Previous Daily Pivot Point R1: 1.3426
Previous Daily Pivot Point R2: 1.3482
Previous Daily Pivot Point R3: 1.3518
Author

Flavio Tosti
Independent Analyst


