|

USD/CAD Price Prediction: More downside expected as wave C extends

  • USD/CAD has pulled back within a strong downtrend. 
  • It will probably continue falling as the wave C of a Measured Move unfolds. 

USD/CAD has pulled back within the midst of a strong downtrending move. On Wednesday the pair recouped about half the losses from the previous day and formed a Marubozu Japanese candlestick continuation pattern. These are long red candles that close near their lows. 

It is often the case that the market will retrace 50% of the Marubozu, which is what happened on Wednesday. Thursday sees a renewal of weakness so far. 

USD/CAD Daily Chart 


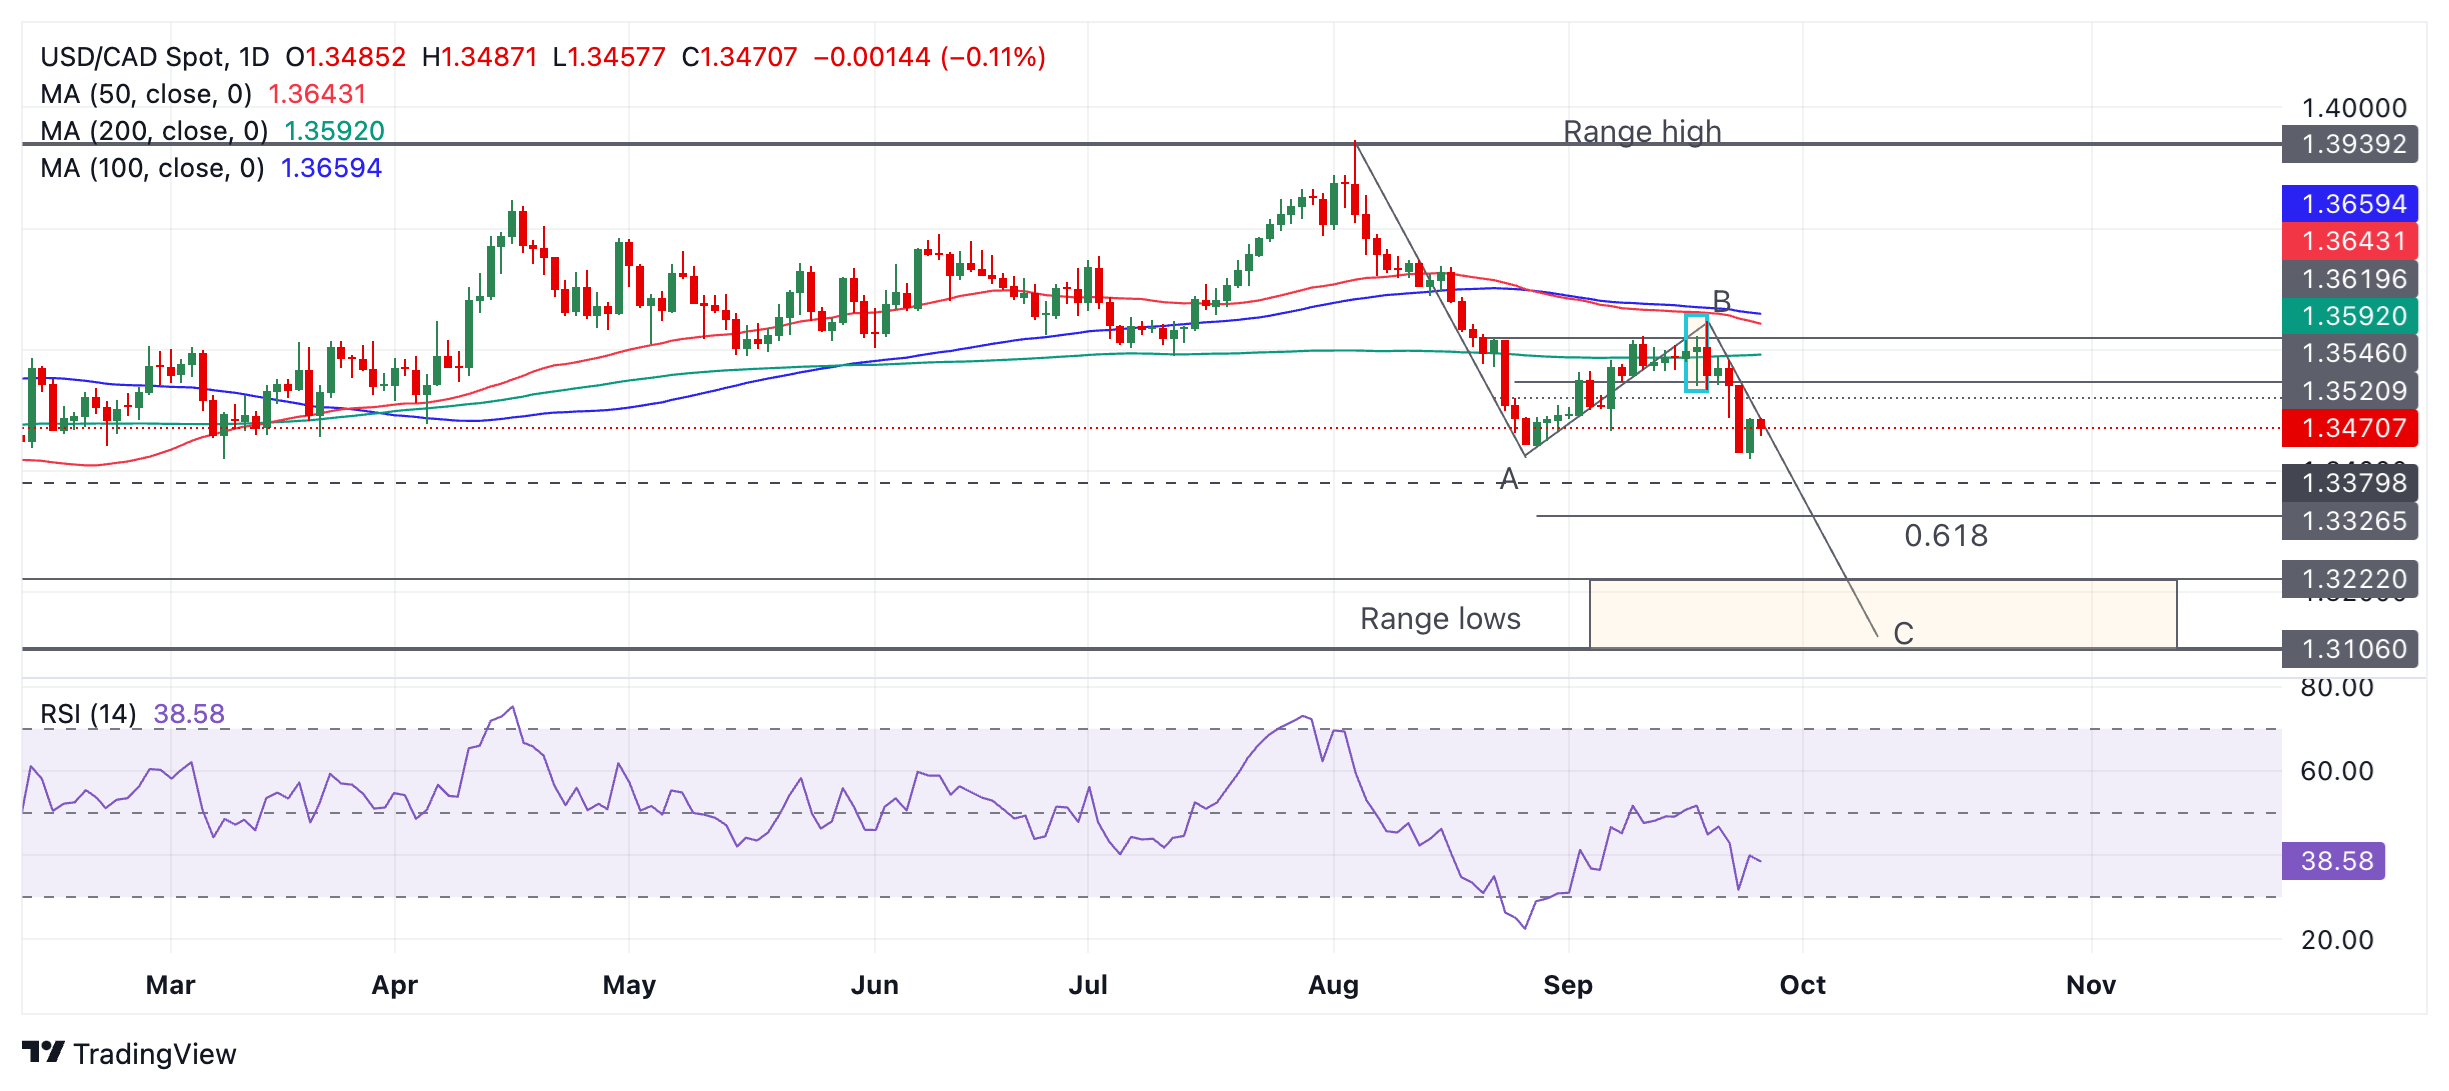
USD/CAD’s move down from the range high, which started on August 5, looks like an ABC pattern, otherwise known as a “Measured Move” (see labels on chart above). Such patterns are like large zig-zags. The wave C usually reaches a similar length to wave A, or at a minimum a Fibonacci 61.8% of A.

Assuming USD/CAD is in a wave C it will probably continue to unfold despite the present pullback. It should reach at least the conservative target for the pattern at 1.3326, the Fibonacci 61.8% extrapolation of wave A. In a very bearish case it could fall to the zone of the range lows (orange shaded rectangle on chart above). 

A break below the low of the Marubozu candle at around 1.3419 would provide bearish confirmation of more downside to the aforesaid targets.

Author

Joaquin Monfort

Joaquin Monfort is a financial writer and analyst with over 10 years experience writing about financial markets and alt data. He holds a degree in Anthropology from London University and a Diploma in Technical analysis.

More from Joaquin Monfort
Share:

Editor's Picks

EUR/USD tests nine-day EMA support near 1.1850

EUR/USD remains in the negative territory for the fourth successive session, trading around 1.1870 during the Asian hours on Friday. The 14-day Relative Strength Index momentum indicator at 56 stays above the midline, confirming steady momentum. RSI has eased but remains above 50, indicating momentum remains constructive for the bulls.

GBP/USD consolidates around 1.3600 vs. USD; looks to US CPI for fresh impetus

The GBP/USD pair remains on the defensive through the Asian session on Friday, though it lacks bearish conviction and holds above the 1.3600 mark as traders await the release of the US consumer inflation figures before placing directional bets.

Gold: Will US CPI data trigger a range breakout?

Gold retakes $5,000 early Friday amid a turnaround from weekly lows as US CPI data loom. The US Dollar consolidates weekly losses as AI concerns-driven risk-off mood stalls downside. Technically, Gold appears primed for a big range breakout, with risks skewed toward a bullish break.

Bitcoin, Ethereum and Ripple stay weak as bearish momentum persists

Bitcoin, Ethereum and Ripple remain under pressure, extending losses of over 5%, 6% and 4%, respectively, so far this week. BTC trades below $67,000 while ETH and XRP correct after facing rejection around key levels. With bearish momentum persisting and prices staying weak, the top three cryptocurrencies continue to show no clear signs of a sustained recovery.

A tale of two labour markets: Headline strength masks underlying weakness

Undoubtedly, yesterday’s delayed US January jobs report delivered a strong headline – one that surpassed most estimates. However, optimism quickly faded amid sobering benchmark revisions.

Aster Price Forecast: Demand sparks on Binance Wallet partnership for on-chain perpetuals

Aster is up roughly 9% so far on Thursday, hinting at the breakout of a crucial resistance level. Aster partners up with Binance wallet for the second season of the on-chain perpetuals challenge.