USD/CAD Price Forecast: Continues to struggles near 20-day EMA
- USD/CAD trades sideways around 1.3700 as investors await fresh headlines regarding US trade negotiations.
- The FOMC minutes signaled that a majority of members do not support interest rate cuts in the near term.
- Investors await the Canadian employment data for June, which is scheduled for Friday.

The USD/CAD pair trades in a tight range near 1.3700 during Asian trading hours on Thursday. The Loonie pair struggles to gauge direction as investors seek fresh development on trade negotiations between the United States (US) and its key trading partners, such as the Eurozone, China, Canada, and Mexico.
Meanwhile, US President Donald Trump has revealed fresh tariff rates for 21 nations that have failed to secure a deal during the 90-day reciprocal tariff pause period. Notable names are Japan and South Korea, which have been imposed with 25% additional import duties.
At the time of writing, the US Dollar Index (DXY), which tracks the Greenback’s value against six major currencies, trades cautiously around 97.40.
On the monetary policy front, the Federal Open Market Committee (FOMC) minutes of the June 17-18 policy meeting have signaled that members would consider monetary policy adjustments appropriate if they see the impact of tariff-led inflation moderate and temporary. This is contrary to the views of US President Trump, who has been criticizing Fed Chair Jerome Powell for not lowering interest rates aggressively.
In Canada, investors await the labor market data for June, which is scheduled to be released on Friday.
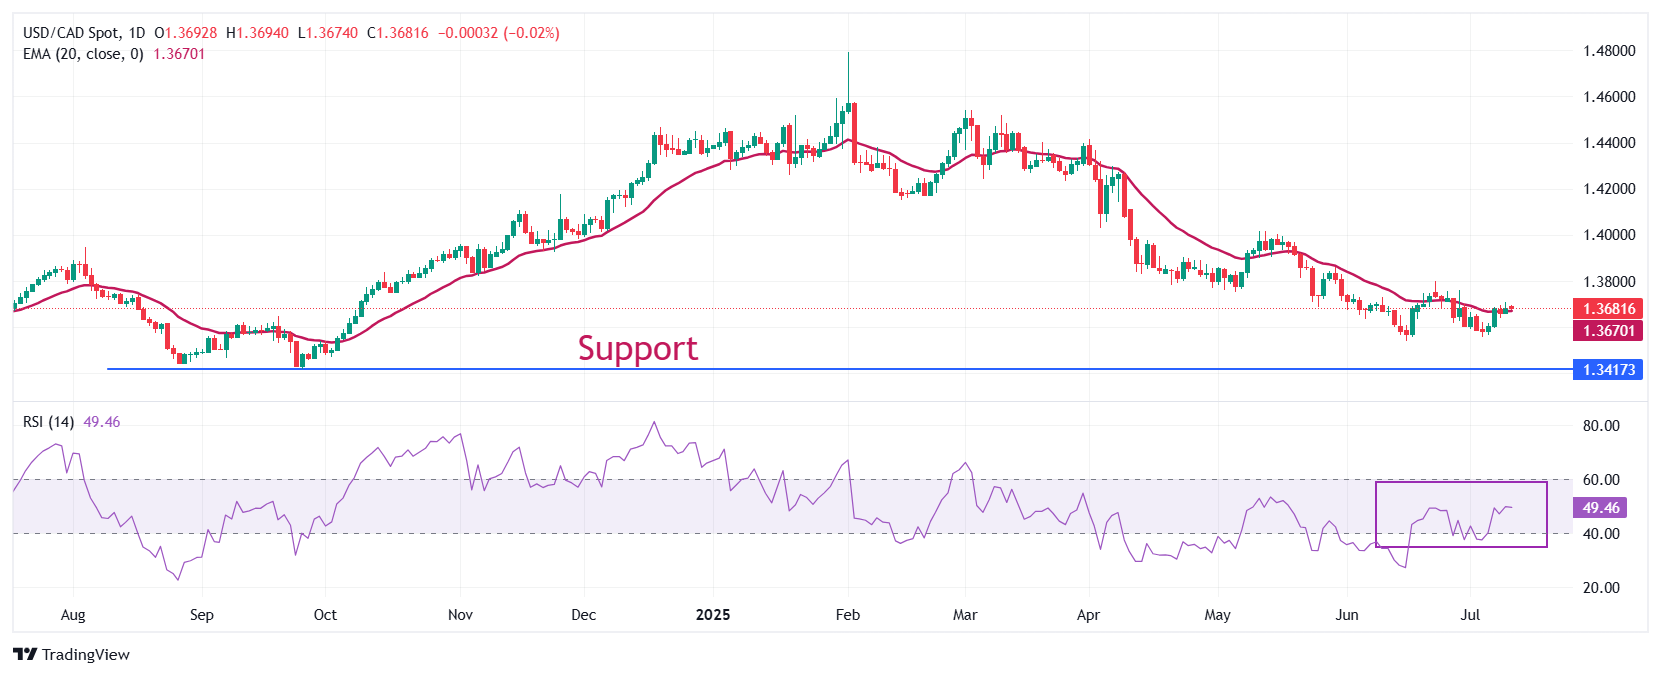
USD/CAD oscillates inside Wednesday’s range around 1.3700. The pair continues to face selling pressure at every breakout attempt above the 20-day Exponential Moving Average (EMA), suggesting a “Sell on Rise” trend.
The 14-day Relative Strength Index (RSI) hovers around 50.00, indicating that the pair lacks momentum on either side.
Going forward, the asset could slide towards the psychological level of 1.3500 and the September 25 low of 1.3420 if it breaks below the June 16 low of 1.3540.
On the contrary, an upside move by the pair above the May 29 high of 1.3820 would open the door towards the May 21 high of 1.3920, followed by the May 15 high of 1.4000.
USD/CAD daily chart
US Dollar FAQs
The US Dollar (USD) is the official currency of the United States of America, and the ‘de facto’ currency of a significant number of other countries where it is found in circulation alongside local notes. It is the most heavily traded currency in the world, accounting for over 88% of all global foreign exchange turnover, or an average of $6.6 trillion in transactions per day, according to data from 2022. Following the second world war, the USD took over from the British Pound as the world’s reserve currency. For most of its history, the US Dollar was backed by Gold, until the Bretton Woods Agreement in 1971 when the Gold Standard went away.
The most important single factor impacting on the value of the US Dollar is monetary policy, which is shaped by the Federal Reserve (Fed). The Fed has two mandates: to achieve price stability (control inflation) and foster full employment. Its primary tool to achieve these two goals is by adjusting interest rates. When prices are rising too quickly and inflation is above the Fed’s 2% target, the Fed will raise rates, which helps the USD value. When inflation falls below 2% or the Unemployment Rate is too high, the Fed may lower interest rates, which weighs on the Greenback.
In extreme situations, the Federal Reserve can also print more Dollars and enact quantitative easing (QE). QE is the process by which the Fed substantially increases the flow of credit in a stuck financial system. It is a non-standard policy measure used when credit has dried up because banks will not lend to each other (out of the fear of counterparty default). It is a last resort when simply lowering interest rates is unlikely to achieve the necessary result. It was the Fed’s weapon of choice to combat the credit crunch that occurred during the Great Financial Crisis in 2008. It involves the Fed printing more Dollars and using them to buy US government bonds predominantly from financial institutions. QE usually leads to a weaker US Dollar.
Quantitative tightening (QT) is the reverse process whereby the Federal Reserve stops buying bonds from financial institutions and does not reinvest the principal from the bonds it holds maturing in new purchases. It is usually positive for the US Dollar.
Author

Sagar Dua
FXStreet
Sagar Dua is associated with the financial markets from his college days. Along with pursuing post-graduation in Commerce in 2014, he started his markets training with chart analysis.


