USD/CAD Price Forecast: Wobbles around 20-day EMA
- USD/CAD edges lower to near 1.3720 while the US Dollar has fallen sharply.
- US President Trump threatens to fire Fed’s Powell again.
- Risks of inflation undershooting BoC’s 2% target has paved the way for interest rate cuts.

The USD/CAD pair ticks down to near 1.3718 during Asian trading hours on Thursday. The Loonie pair trades slightly lower, while the US Dollar (USD) declines sharply as United States (US) President Donald Trump has reiterated threats to fire Federal Reserve (Fed) Chair Jerome Powell. The scenario reflects that the Canadian Dollar (CAD) is also under pressure.
Canadian Dollar PRICE Today
The table below shows the percentage change of Canadian Dollar (CAD) against listed major currencies today. Canadian Dollar was the weakest against the British Pound.
| USD | EUR | GBP | JPY | CAD | AUD | NZD | CHF | |
|---|---|---|---|---|---|---|---|---|
| USD | -0.17% | -0.32% | -0.22% | -0.06% | -0.20% | -0.13% | -0.10% | |
| EUR | 0.17% | -0.09% | -0.12% | 0.14% | 0.01% | 0.04% | 0.10% | |
| GBP | 0.32% | 0.09% | 0.00% | 0.23% | 0.11% | 0.16% | 0.19% | |
| JPY | 0.22% | 0.12% | 0.00% | 0.20% | 0.07% | 0.09% | 0.16% | |
| CAD | 0.06% | -0.14% | -0.23% | -0.20% | -0.12% | -0.17% | -0.04% | |
| AUD | 0.20% | -0.01% | -0.11% | -0.07% | 0.12% | -0.04% | 0.08% | |
| NZD | 0.13% | -0.04% | -0.16% | -0.09% | 0.17% | 0.04% | 0.12% | |
| CHF | 0.10% | -0.10% | -0.19% | -0.16% | 0.04% | -0.08% | -0.12% |
The heat map shows percentage changes of major currencies against each other. The base currency is picked from the left column, while the quote currency is picked from the top row. For example, if you pick the Canadian Dollar from the left column and move along the horizontal line to the US Dollar, the percentage change displayed in the box will represent CAD (base)/USD (quote).
The US Dollar Index (DXY), which tracks the Greenback’s value against six major currencies, refreshes the three-year low around 97.25.
Donald Trump floated the idea of replacing Fed’s Powell after his comments at his two-day semi-annual testimony before Senate in which he stated that the central bank is “well positioned to wait to learn more about the likely course of the economy before considering any adjustments to our policy stance”. Powell remained open to the possibility that “tariffs translating to inflation will be more or less than we think".
Meanwhile, the Canadian Dollar has been on the back foot as inflation remaining well-below the Bank of Canada’s (BoC) 2% target has increased hopes of more interest rate cuts. The data showed on Tuesday that the headline Consumer Price Index (CPI) grew by 1.7% on year, which was in-line with market expectations and the prior release. In the same, the BoC CPI core rose steadily by 2.5%.
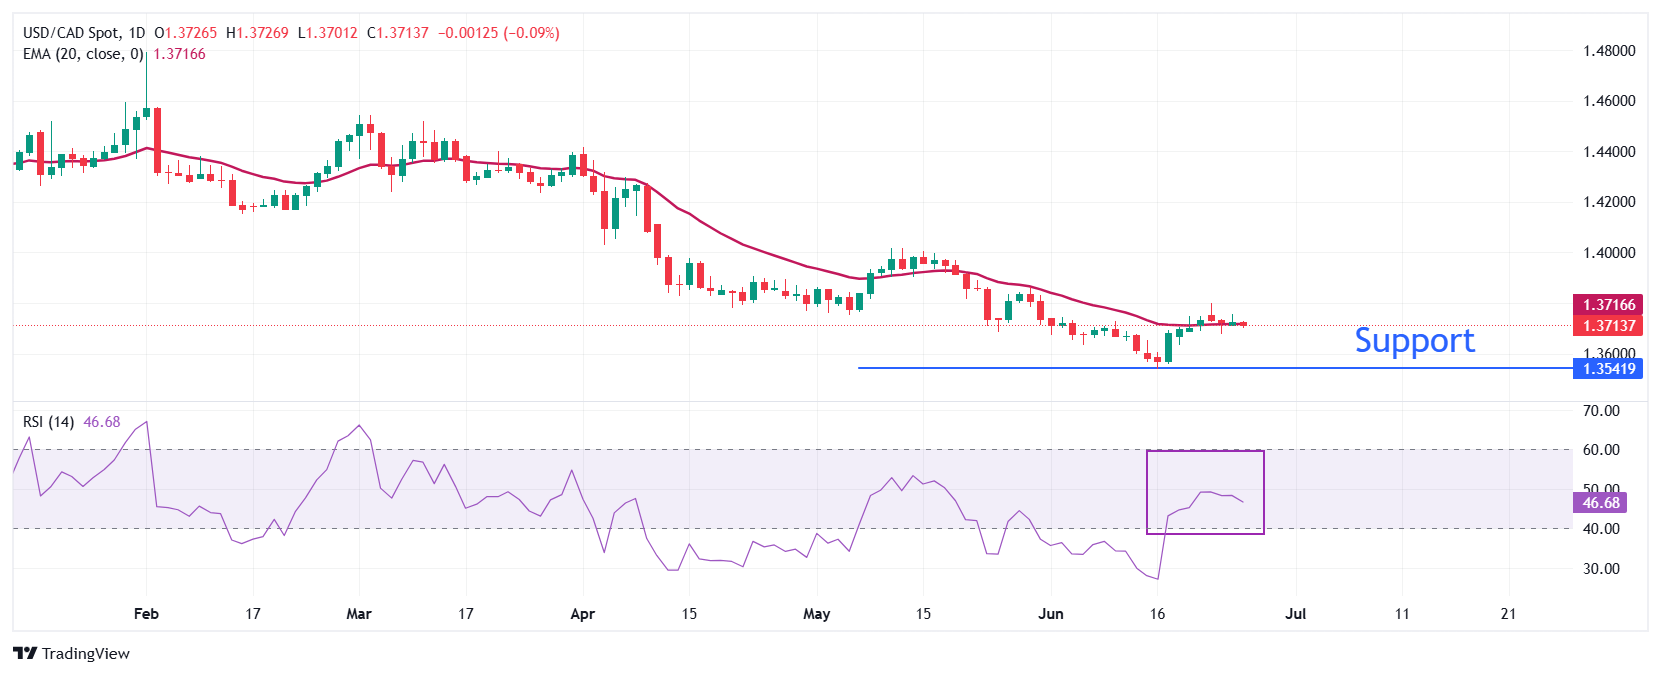
USD/CAD wobbles near the 20-day Exponential Moving Average (EMA), which trades around 1.3717, is suggesting a sideways trend. The 14-day Relative Strength Index (RSI) oscillates inside the 40.00-60.00 range, which indicates a sharp volatility contraction.
Going forward, an upside move above the May 29 high of 1.3820 by the pair would open the door towards the May 21 high of 1.3920, followed by the May 15 high of 1.4000.
On the contrary, the asset could slide towards the psychological level of 1.3500 and the September 25 low of 1.3420 if it breaks below the June 16 low of 1.3540.
USD/CAD daily chart
US Dollar FAQs
The US Dollar (USD) is the official currency of the United States of America, and the ‘de facto’ currency of a significant number of other countries where it is found in circulation alongside local notes. It is the most heavily traded currency in the world, accounting for over 88% of all global foreign exchange turnover, or an average of $6.6 trillion in transactions per day, according to data from 2022. Following the second world war, the USD took over from the British Pound as the world’s reserve currency. For most of its history, the US Dollar was backed by Gold, until the Bretton Woods Agreement in 1971 when the Gold Standard went away.
The most important single factor impacting on the value of the US Dollar is monetary policy, which is shaped by the Federal Reserve (Fed). The Fed has two mandates: to achieve price stability (control inflation) and foster full employment. Its primary tool to achieve these two goals is by adjusting interest rates. When prices are rising too quickly and inflation is above the Fed’s 2% target, the Fed will raise rates, which helps the USD value. When inflation falls below 2% or the Unemployment Rate is too high, the Fed may lower interest rates, which weighs on the Greenback.
In extreme situations, the Federal Reserve can also print more Dollars and enact quantitative easing (QE). QE is the process by which the Fed substantially increases the flow of credit in a stuck financial system. It is a non-standard policy measure used when credit has dried up because banks will not lend to each other (out of the fear of counterparty default). It is a last resort when simply lowering interest rates is unlikely to achieve the necessary result. It was the Fed’s weapon of choice to combat the credit crunch that occurred during the Great Financial Crisis in 2008. It involves the Fed printing more Dollars and using them to buy US government bonds predominantly from financial institutions. QE usually leads to a weaker US Dollar.
Quantitative tightening (QT) is the reverse process whereby the Federal Reserve stops buying bonds from financial institutions and does not reinvest the principal from the bonds it holds maturing in new purchases. It is usually positive for the US Dollar.
Author

Sagar Dua
FXStreet
Sagar Dua is associated with the financial markets from his college days. Along with pursuing post-graduation in Commerce in 2014, he started his markets training with chart analysis.


