USD/CAD Price Forecast: Trades tightly around 1.3650
- USD/CAD trades well inside Tuesday’s trading range around 1.3650 ahead of key US labor market data.
- Investors have sidelined while awaiting clarity on the status of bilateral deals between the US and its trading partners.
- US-Canada trade talks to resume as Canadian officials eliminates digital service tax.

The USD/CAD pair trades in a very tight range near 1.3650 during the Asian trading session on Wednesday. The Loonie trades consolidates as investors await the United States (US) Nonfarm Payrolls (NFP) data for June for fresh cues on the Federal Reserve’s (Fed) monetary policy outlook.
Ahead of the US NFP report release, investors will pay close attention to the ADP Employment Change data for June, which will be published at 12:15 GMT.
According to the CME FedWatch tool, the Fed is almost certain to cut interest rates in the September policy meeting after leaving them unchanged this month.
Additionally, uncertainty surrounding bilateral deals by the US with its trading partners ahead of the July 9 tariff deadline and the impact of President Donald Trump’s tax-cut bill has forced investors to stay on the sidelines.
Meanwhile, de-escalating trade tensions between the US and Canada are expected to strengthen the Canadian Dollar (CAD). White House economic adviser Kevin Hassett expressed confidence on Monday that trade talks with Canada will resume as the nation has rolled back digital service tax levied on US technology companies.
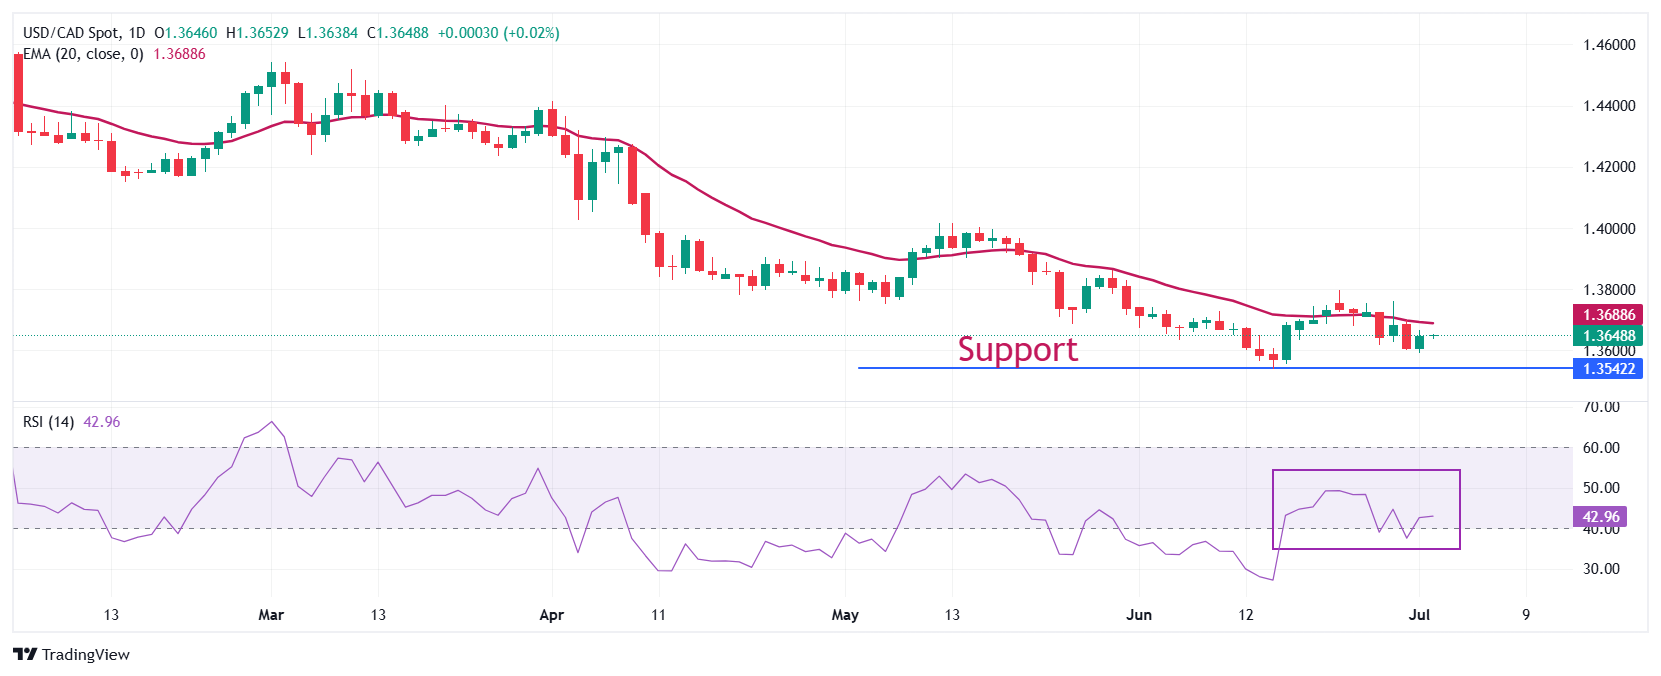
USD/CAD continues to face selling pressure at every attempt above the 20-day Exponential Moving Average (EMA), suggesting a “Sell on Rise” trend. The 14-day Relative Strength Index (RSI) oscillates near 40.00. A fresh bearish momentum would appear if the RSI breaks below that level.
Going forward, the asset could slide towards the psychological level of 1.3500 and the September 25 low of 1.3420 if it breaks below the June 16 low of 1.3540.
On the contrary, an upside move by the pair above the May 29 high of 1.3820 would open the door towards the May 21 high of 1.3920, followed by the May 15 high of 1.4000.
USD/CAD daily chart
US Dollar FAQs
The US Dollar (USD) is the official currency of the United States of America, and the ‘de facto’ currency of a significant number of other countries where it is found in circulation alongside local notes. It is the most heavily traded currency in the world, accounting for over 88% of all global foreign exchange turnover, or an average of $6.6 trillion in transactions per day, according to data from 2022. Following the second world war, the USD took over from the British Pound as the world’s reserve currency. For most of its history, the US Dollar was backed by Gold, until the Bretton Woods Agreement in 1971 when the Gold Standard went away.
The most important single factor impacting on the value of the US Dollar is monetary policy, which is shaped by the Federal Reserve (Fed). The Fed has two mandates: to achieve price stability (control inflation) and foster full employment. Its primary tool to achieve these two goals is by adjusting interest rates. When prices are rising too quickly and inflation is above the Fed’s 2% target, the Fed will raise rates, which helps the USD value. When inflation falls below 2% or the Unemployment Rate is too high, the Fed may lower interest rates, which weighs on the Greenback.
In extreme situations, the Federal Reserve can also print more Dollars and enact quantitative easing (QE). QE is the process by which the Fed substantially increases the flow of credit in a stuck financial system. It is a non-standard policy measure used when credit has dried up because banks will not lend to each other (out of the fear of counterparty default). It is a last resort when simply lowering interest rates is unlikely to achieve the necessary result. It was the Fed’s weapon of choice to combat the credit crunch that occurred during the Great Financial Crisis in 2008. It involves the Fed printing more Dollars and using them to buy US government bonds predominantly from financial institutions. QE usually leads to a weaker US Dollar.
Quantitative tightening (QT) is the reverse process whereby the Federal Reserve stops buying bonds from financial institutions and does not reinvest the principal from the bonds it holds maturing in new purchases. It is usually positive for the US Dollar.
Author

Sagar Dua
FXStreet
Sagar Dua is associated with the financial markets from his college days. Along with pursuing post-graduation in Commerce in 2014, he started his markets training with chart analysis.


