USD/CAD Price Forecast: Tests initial support at 1.3800 near six-month lows
- The USD/CAD pair could test the six-month low of 1.3781.
- The 14-day RSI remains above the 30 level, reinforcing the prevailing bearish bias.
- The pair could test the upper boundary of the descending channel near 1.3840.

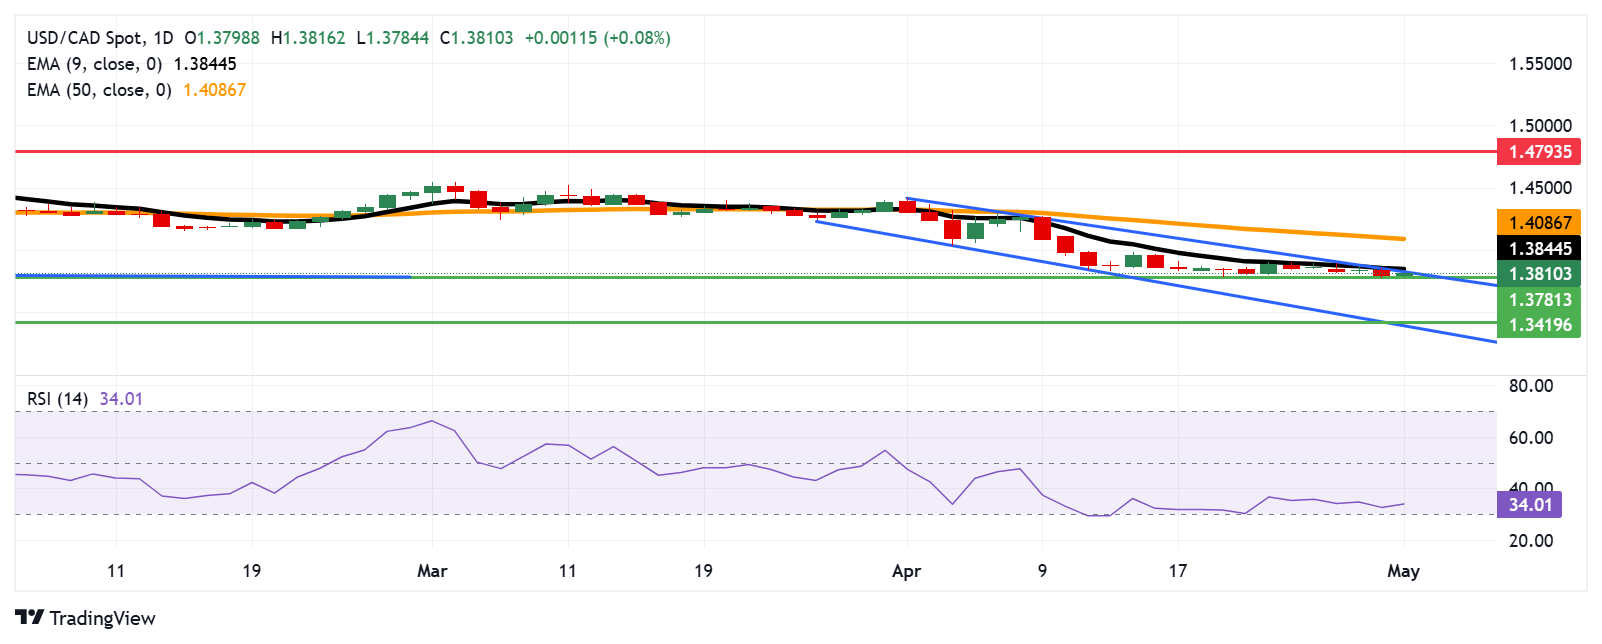
The USD/CAD pair retraces its losses registered in the previous session, trading around 1.3810 during the European hours on Thursday. However, technical analysis on the daily chart indicates a prevailing bearish trend, with the pair continuing to move lower within a clearly defined descending channel.
Additionally, the 14-day Relative Strength Index (RSI) remains above the 30 level, reinforcing the prevailing bearish bias. A breach below the 30 mark would indicate an oversold situation and a potential for a corrective rebound in the near future. Additionally, the USD/CAD pair remains below the nine-day Exponential Moving Average (EMA), indicating a weaker short-term price momentum.
On the downside, the USD/CAD pair is testing the six-month low of 1.3781, last touched on April 21. A clear break below this level would reinforce the bearish bias, potentially driving the pair toward the 1.3419 — its lowest point since February 2024, with additional support seen around the descending channel’s lower boundary near the 1.3400 area
The USD/CAD pair could test the upper boundary of the descending channel near 1.3840, aligned with the nine-day EMA of 1.3844. A break above this crucial resistance zone would improve the short-term price momentum and would signal a potential shift toward a bullish bias, paving the way for a move toward the 50-day EMA at 1.4086. Further gains could target the next major resistance at 1.4793 — the lowest level observed since April 2003.
USD/CAD: Daily Chart
Canadian Dollar PRICE Today
The table below shows the percentage change of Canadian Dollar (CAD) against listed major currencies today. Canadian Dollar was the weakest against the US Dollar.
| USD | EUR | GBP | JPY | CAD | AUD | NZD | CHF | |
|---|---|---|---|---|---|---|---|---|
| USD | 0.19% | 0.18% | 0.94% | 0.08% | 0.19% | 0.11% | 0.16% | |
| EUR | -0.19% | -0.01% | 0.75% | -0.14% | -0.01% | -0.08% | -0.04% | |
| GBP | -0.18% | 0.01% | 0.75% | -0.10% | 0.00% | -0.07% | -0.04% | |
| JPY | -0.94% | -0.75% | -0.75% | -0.87% | -0.75% | -0.88% | -0.86% | |
| CAD | -0.08% | 0.14% | 0.10% | 0.87% | 0.12% | 0.03% | 0.06% | |
| AUD | -0.19% | 0.01% | -0.00% | 0.75% | -0.12% | -0.08% | -0.05% | |
| NZD | -0.11% | 0.08% | 0.07% | 0.88% | -0.03% | 0.08% | 0.03% | |
| CHF | -0.16% | 0.04% | 0.04% | 0.86% | -0.06% | 0.05% | -0.03% |
The heat map shows percentage changes of major currencies against each other. The base currency is picked from the left column, while the quote currency is picked from the top row. For example, if you pick the Canadian Dollar from the left column and move along the horizontal line to the US Dollar, the percentage change displayed in the box will represent CAD (base)/USD (quote).
Author

Akhtar Faruqui
FXStreet
Akhtar Faruqui is a Forex Analyst based in New Delhi, India. With a keen eye for market trends and a passion for dissecting complex financial dynamics, he is dedicated to delivering accurate and insightful Forex news and analysis.


