USD/CAD Price Forecast: Recovers to near 1.4200
- USD/CAD rises to near 1.4200 as the US Dollar bounces back from the YTD low.
- Fed officials have been guiding a restrictive monetary policy stance.
- Investors await the Canadian Retail Sales data and BoC Macklem’s speech.

The USD/CAD pair gains to near the key resistance of 1.4200 in European trading hours on Friday. The Loonie pair moves higher after recovering from the three-day low of 1.4166, which it posted on Thursday. The asset rebounds due to a recovery move in the US Dollar (USD), with the US Dollar Index (DXY), bouncing back to near 106.65 from the Year-to-date (YTD) low of 106.30 recorded on Thursday.
The recovery move in the Greenback appears to be short-lived as its risk premium has diminished, with investors start digesting United States (US) President Donald Trump’s tariff agenda and optimism over Russia-Ukraine peace.
On the monetary policy, Federal Reserve (Fed) officials remain confident that interest rates should remain in the current range as they lack details of Trump’s tariff and taxations policies.
Though investors have underpinned the US Dollar against the Canadian Dollar (CAD) on Friday, it is outperforming other peers even though traders remain confident the Bank of Canada (BoC) will ease its monetary policy further.
Meanwhile, investors await the Canadian Retail Sales data for December and BoC Governor Tiff Macklem’s speech at an event at Mississauga, Ontario.
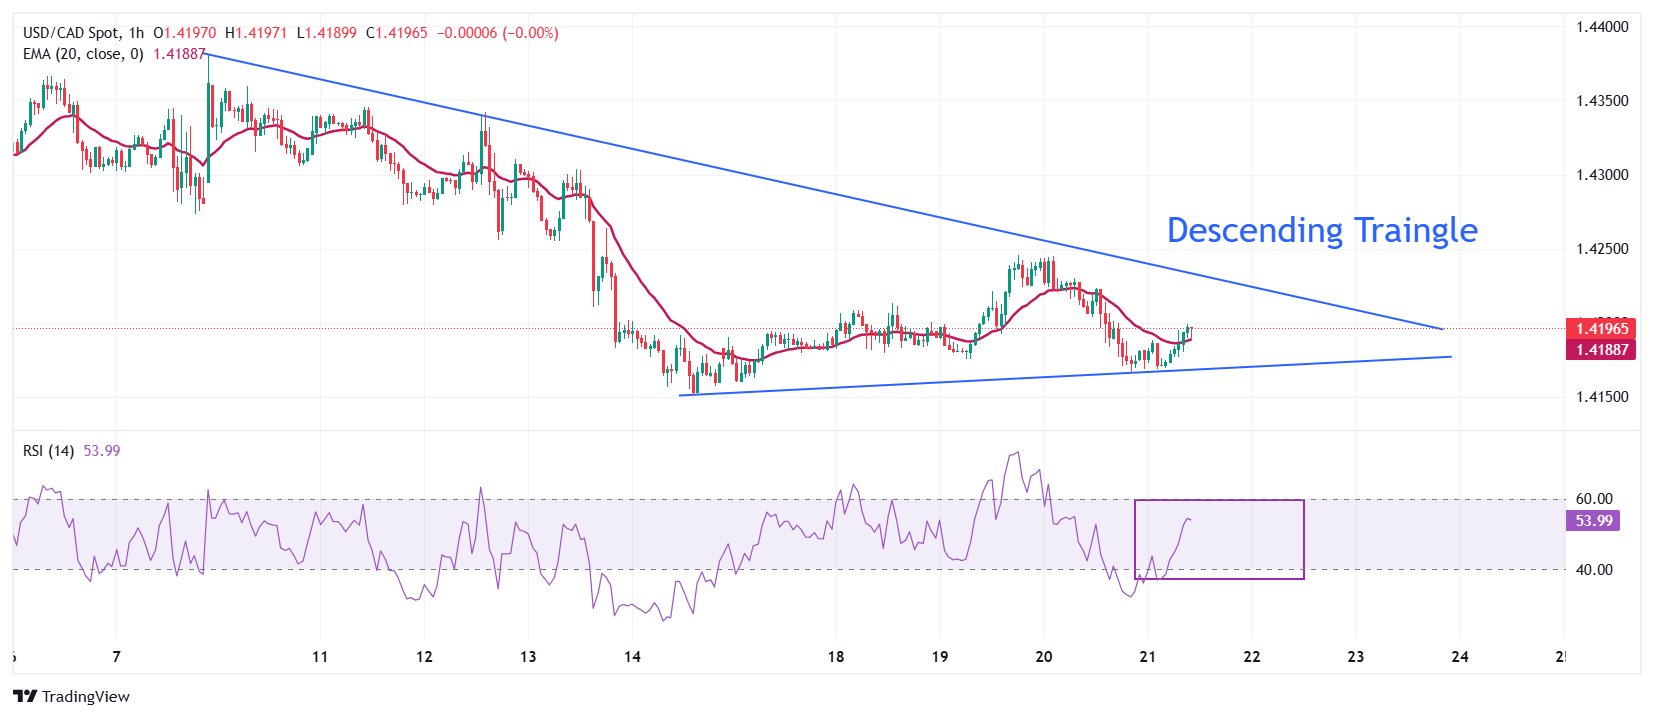
USD/CAD trades in a Descending Triangle chart pattern formed on an hourly timeframe. The downward-sloping border of the above-mentioned chart pattern is plotted from the February 9 high of 1.4380 and the flat border is placed from the February 14 low of 1.4151.
The 20-period Exponential Moving Average (EMA) overlaps the Loonie price, suggesting a sideways trend.
The 14-period Relative Strength Index (RSI) trades inside the 40.00-60.00 range, which indicates an indecisiveness among investors.
The pair has remained in a downtrend since the first trading day of February and could see more downside on a breakdown below the February 14 low of 1.4151 towards the December 9 low of 1.4094, followed by the December 6 low of 1.4020.
On the contrary, an upside move above the February 19 high of 1.4246 will open the door toward the round-level resistance of 1.4300 and the February 9 high of 1.4380.
USD/CAD hourly chart
US Dollar FAQs
The US Dollar (USD) is the official currency of the United States of America, and the ‘de facto’ currency of a significant number of other countries where it is found in circulation alongside local notes. It is the most heavily traded currency in the world, accounting for over 88% of all global foreign exchange turnover, or an average of $6.6 trillion in transactions per day, according to data from 2022. Following the second world war, the USD took over from the British Pound as the world’s reserve currency. For most of its history, the US Dollar was backed by Gold, until the Bretton Woods Agreement in 1971 when the Gold Standard went away.
The most important single factor impacting on the value of the US Dollar is monetary policy, which is shaped by the Federal Reserve (Fed). The Fed has two mandates: to achieve price stability (control inflation) and foster full employment. Its primary tool to achieve these two goals is by adjusting interest rates. When prices are rising too quickly and inflation is above the Fed’s 2% target, the Fed will raise rates, which helps the USD value. When inflation falls below 2% or the Unemployment Rate is too high, the Fed may lower interest rates, which weighs on the Greenback.
In extreme situations, the Federal Reserve can also print more Dollars and enact quantitative easing (QE). QE is the process by which the Fed substantially increases the flow of credit in a stuck financial system. It is a non-standard policy measure used when credit has dried up because banks will not lend to each other (out of the fear of counterparty default). It is a last resort when simply lowering interest rates is unlikely to achieve the necessary result. It was the Fed’s weapon of choice to combat the credit crunch that occurred during the Great Financial Crisis in 2008. It involves the Fed printing more Dollars and using them to buy US government bonds predominantly from financial institutions. QE usually leads to a weaker US Dollar.
Quantitative tightening (QT) is the reverse process whereby the Federal Reserve stops buying bonds from financial institutions and does not reinvest the principal from the bonds it holds maturing in new purchases. It is usually positive for the US Dollar.
Author

Sagar Dua
FXStreet
Sagar Dua is associated with the financial markets from his college days. Along with pursuing post-graduation in Commerce in 2014, he started his markets training with chart analysis.


