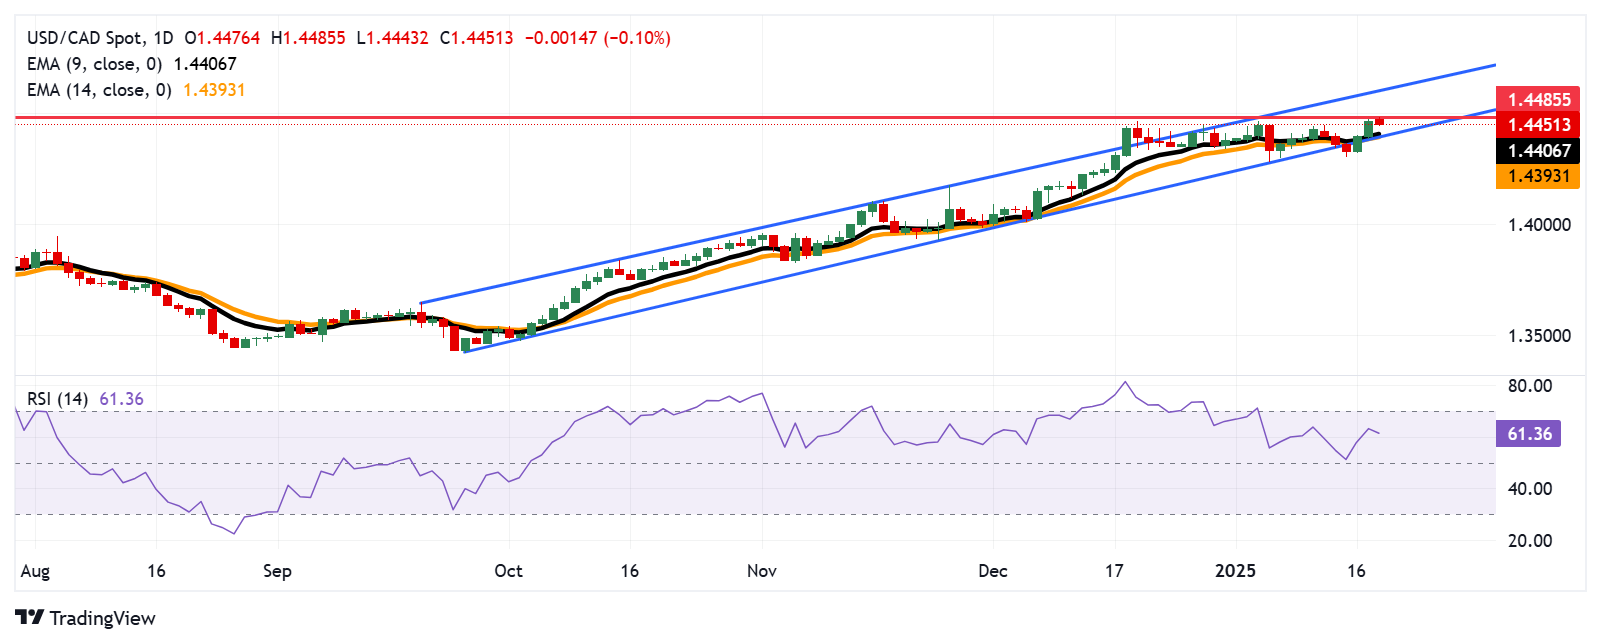
USD/CAD Price Forecast: Pulls back from multi-year highs near 1.4500
- USD/CAD retreats from 1.4485, the highest level since March 2020, approached on Monday.
- The bullish bias remains intact, with the 14-day RSI holding above the 50 mark, signaling sustained upward momentum.
- The nine-day EMA at the 1.4405 level serves as initial support for the pair.

The USD/CAD pair ends its two-day winning streak, trading near 1.4450 during Monday's European session. From a technical standpoint, the daily chart suggests the pair trading within an ascending channel, indicating a continued bullish bias.
The 14-day Relative Strength Index (RSI) remains above the 50 level, reflecting sustained bullish momentum. If the RSI holds above 50, it could reinforce positive sentiment.
Furthermore, USD/CAD trades above the nine- and 14-day Exponential Moving Averages (EMAs), highlighting a bullish trend and strong short-term price momentum. This alignment signals solid buying interest and suggests the potential for further upside movement.
The USD/CAD pair continues to challenge the 1.4485, the highest level since March 2020, recorded on January 20. A further resistance level is positioned at the upper boundary of the ascending channel, near the key psychological mark of 1.4600.
On the downside, the initial support lies around the nine-day EMA at 1.4405, followed by the 14-day EMA at 1.4392, aligned with the lower boundary of the ascending channel.
USD/CAD: Daily Chart
Canadian Dollar PRICE Today
The table below shows the percentage change of Canadian Dollar (CAD) against listed major currencies today. Canadian Dollar was the weakest against the New Zealand Dollar.
| USD | EUR | GBP | JPY | CAD | AUD | NZD | CHF | |
|---|---|---|---|---|---|---|---|---|
| USD | -0.41% | -0.35% | -0.09% | -0.14% | -0.46% | -0.43% | -0.03% | |
| EUR | 0.41% | -0.00% | 0.23% | 0.16% | 0.02% | -0.11% | 0.25% | |
| GBP | 0.35% | 0.00% | 0.17% | 0.15% | 0.02% | -0.13% | 0.25% | |
| JPY | 0.09% | -0.23% | -0.17% | -0.04% | -0.32% | -0.43% | -0.11% | |
| CAD | 0.14% | -0.16% | -0.15% | 0.04% | -0.26% | -0.29% | 0.09% | |
| AUD | 0.46% | -0.02% | -0.02% | 0.32% | 0.26% | -0.24% | 0.17% | |
| NZD | 0.43% | 0.11% | 0.13% | 0.43% | 0.29% | 0.24% | 0.20% | |
| CHF | 0.03% | -0.25% | -0.25% | 0.11% | -0.09% | -0.17% | -0.20% |
The heat map shows percentage changes of major currencies against each other. The base currency is picked from the left column, while the quote currency is picked from the top row. For example, if you pick the Canadian Dollar from the left column and move along the horizontal line to the US Dollar, the percentage change displayed in the box will represent CAD (base)/USD (quote).
Author

Akhtar Faruqui
FXStreet
Akhtar Faruqui is a Forex Analyst based in New Delhi, India. With a keen eye for market trends and a passion for dissecting complex financial dynamics, he is dedicated to delivering accurate and insightful Forex news and analysis.


