USD/CAD Price Forecast: Potential double top near 1.3960
- The US Dollar is drifting lower from session highs around 1.3950.
- Downbeat US data is weighing the US Dollar, but CAD's weakness is keeping the pair afloat.
- The technical picture suggests a potential double top at 1.3958, with its neckline at 1.3895.

The US Dollar is drifting away from Tuesday’s highs at 1.3957 against the Canadian Dollar in Wednesday’s early European session. The broader trend remains positive, but failure to breach resistance around the 1.3960 area might trigger a deeper correction.
The fundamental background is not particularly supportive for the US Dollar, as weak labour data are boosting hopes of Fed cuts in the coming months, but the broad-based Canadian Dollar’s weakness keeps the USD afloat for now.
Technical Analysis: Key support is at 1.3895
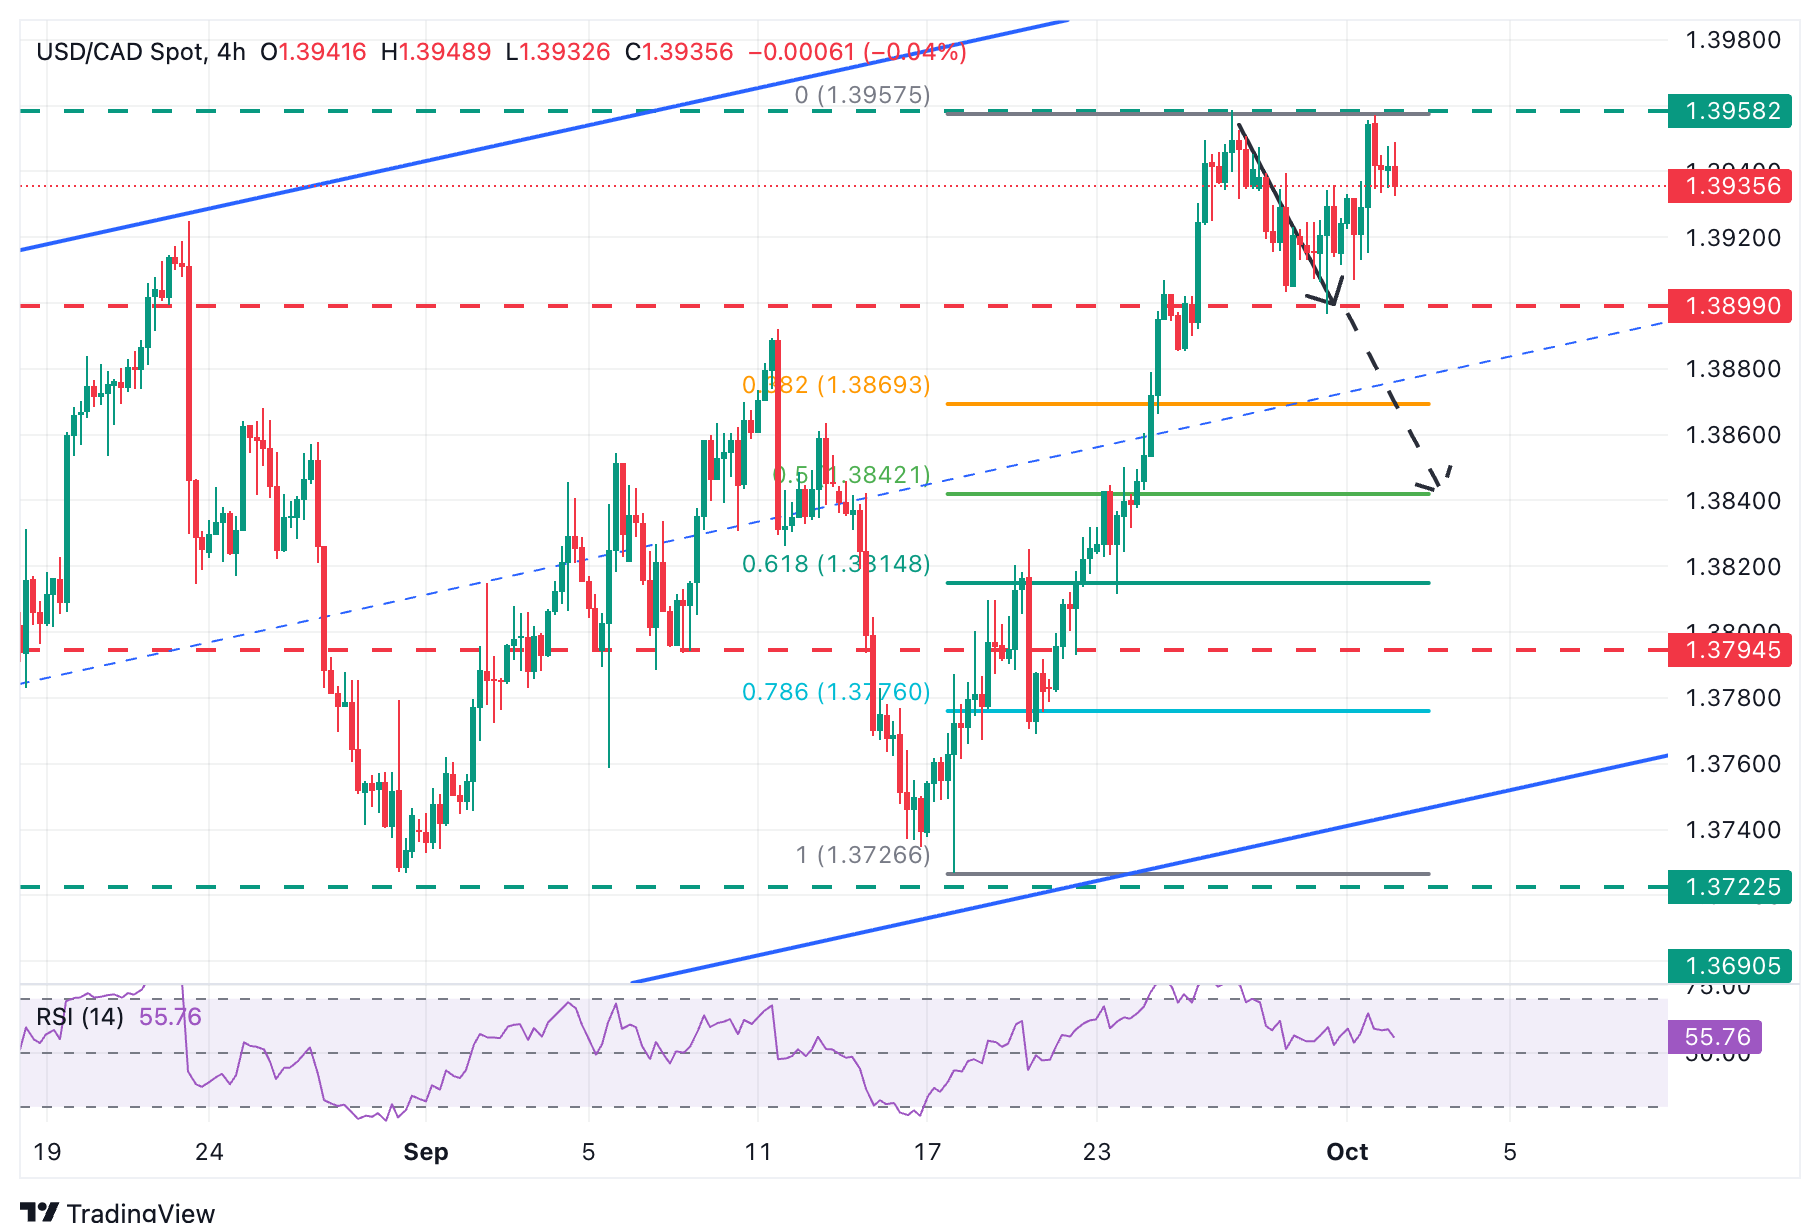
The technical picture shows a potential double top right above 1.3960 (September 26, October 1 lows), a common pattern for trend shifts. In the 4-hour charts, a bearish divergence on the Relative Strength IIndex (RSI) endorses this view.
Price action is still well above the DT’s trendline, at the September 30 low of 1.3895. Below here, the 38.2% Fibonacci retracement of the late September rally is at 1.3869. The pattern’s measured target is at the 50% Fibonacci retracement of the mentioned cycle, at 1.3842.
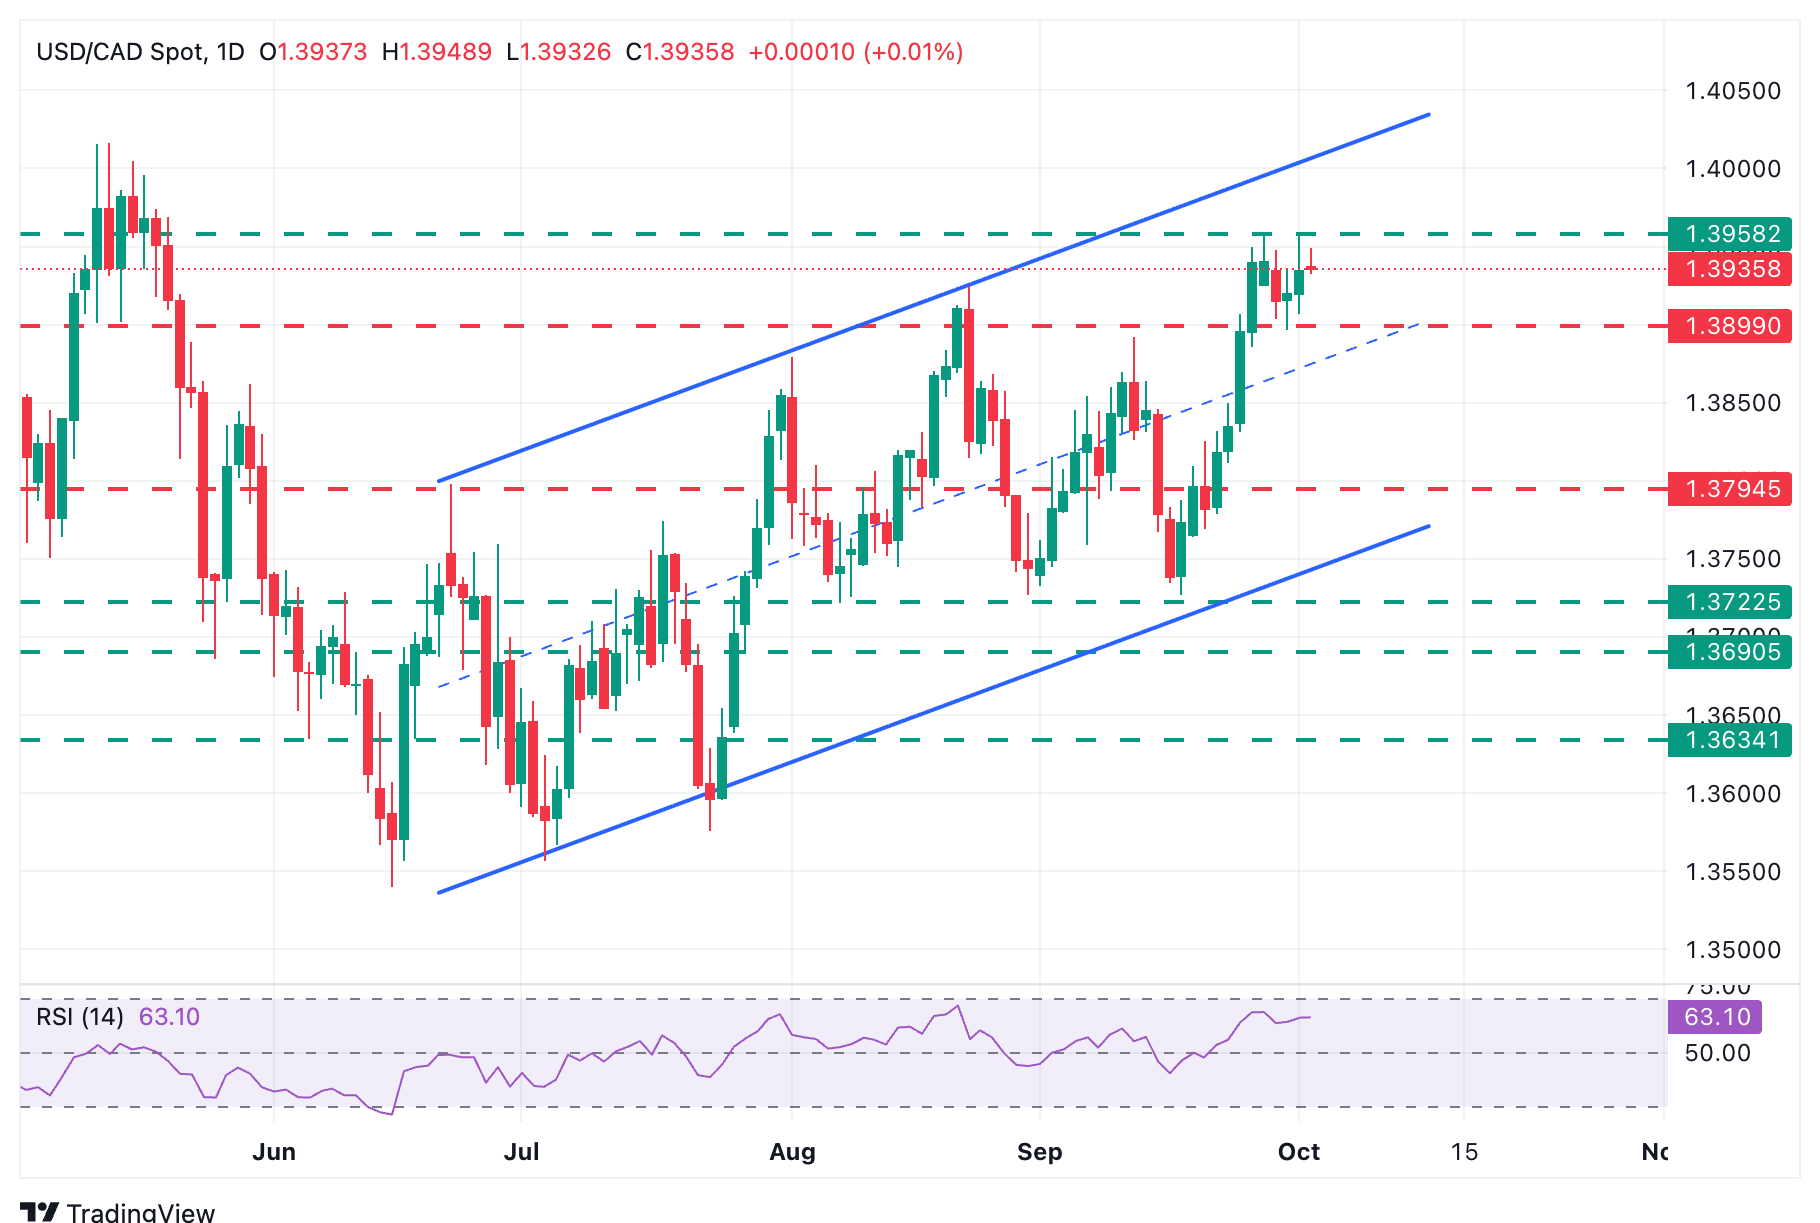
A confirmation above the 1.3960 level, on the other hand, cancels this view and shifts the focus towards the trendline resistance, at the 1.4000 area and the mid-May highs, at 1.4020.
US Dollar Price Today
The table below shows the percentage change of US Dollar (USD) against listed major currencies today. US Dollar was the strongest against the Japanese Yen.
| USD | EUR | GBP | JPY | CAD | AUD | NZD | CHF | |
|---|---|---|---|---|---|---|---|---|
| USD | -0.17% | -0.12% | 0.04% | 0.00% | -0.13% | -0.52% | -0.08% | |
| EUR | 0.17% | 0.04% | 0.19% | 0.16% | 0.03% | -0.24% | 0.07% | |
| GBP | 0.12% | -0.04% | 0.18% | 0.09% | 0.01% | -0.27% | 0.05% | |
| JPY | -0.04% | -0.19% | -0.18% | -0.04% | -0.17% | -0.67% | -0.09% | |
| CAD | -0.01% | -0.16% | -0.09% | 0.04% | -0.14% | -0.38% | -0.07% | |
| AUD | 0.13% | -0.03% | -0.01% | 0.17% | 0.14% | -0.34% | 0.06% | |
| NZD | 0.52% | 0.24% | 0.27% | 0.67% | 0.38% | 0.34% | 0.48% | |
| CHF | 0.08% | -0.07% | -0.05% | 0.09% | 0.07% | -0.06% | -0.48% |
The heat map shows percentage changes of major currencies against each other. The base currency is picked from the left column, while the quote currency is picked from the top row. For example, if you pick the US Dollar from the left column and move along the horizontal line to the Japanese Yen, the percentage change displayed in the box will represent USD (base)/JPY (quote).
Author

Guillermo Alcala
FXStreet
Graduated in Communication Sciences at the Universidad del Pais Vasco and Universiteit van Amsterdam, Guillermo has been working as financial news editor and copywriter in diverse Forex-related firms, like FXStreet and Kantox.