USD/CAD Price Forecast: Hits fresh seven-month highs above 1.4100
- USD/CAD recorded a new seven-month high of 1.4120 on Wednesday.
- The 14-day Relative Strength Index remains below 70, indicating a bullish bias while nearing overbought territory.
- The immediate support lies at the psychological level of 1.4100.

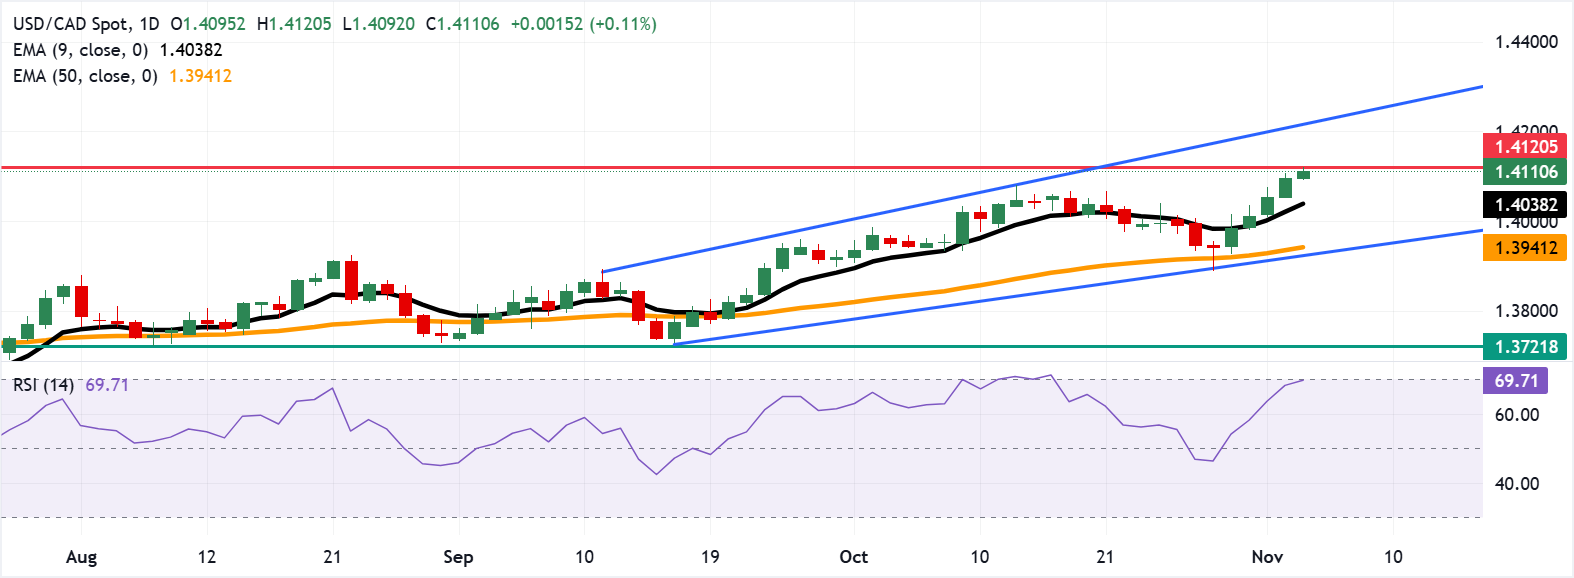
USD/CAD continues its winning streak for the fifth consecutive day, trading around 1.4110 during the European hours on Wednesday. The technical analysis of the daily chart indicates a persistent bullish bias, with the pair moving upwards within the ascending channel pattern.
Additionally, the short-term price momentum is strengthening as the pair rises above the nine-day Exponential Moving Average (EMA). The 14-day Relative Strength Index (RSI) sits just below the 70 level, reinforcing the bullish bias. Any further gains would push the USD/CAD pair into overbought territory and signal a potential near-term correction.
The USD/CAD pair has reached a new seven-month high of 1.4120, earlier during the Asian hours. Further advances would likely explore the area around the upper boundary of the ascending channel at 1.4220.
On the downside, the primary support lies at the psychological level of 1.4100, followed by the nine-day EMA of 1.4038. A break below this level would weaken the short-term price momentum and put downward pressure on the USD/CAD pair to test the 50-day EMA at 1.3941, followed by the ascending channel’s lower boundary around 1.3930.
Canadian Dollar Price Today
The table below shows the percentage change of Canadian Dollar (CAD) against listed major currencies today. Canadian Dollar was the weakest against the British Pound.
| USD | EUR | GBP | JPY | CAD | AUD | NZD | CHF | |
|---|---|---|---|---|---|---|---|---|
| USD | -0.11% | -0.22% | -0.12% | 0.16% | -0.08% | -0.12% | -0.12% | |
| EUR | 0.11% | -0.12% | -0.02% | 0.26% | 0.03% | 0.00% | -0.01% | |
| GBP | 0.22% | 0.12% | 0.10% | 0.37% | 0.13% | 0.10% | 0.10% | |
| JPY | 0.12% | 0.02% | -0.10% | 0.28% | 0.04% | -0.01% | 0.00% | |
| CAD | -0.16% | -0.26% | -0.37% | -0.28% | -0.23% | -0.29% | -0.28% | |
| AUD | 0.08% | -0.03% | -0.13% | -0.04% | 0.23% | -0.04% | -0.05% | |
| NZD | 0.12% | -0.00% | -0.10% | 0.00% | 0.29% | 0.04% | 0.00% | |
| CHF | 0.12% | 0.01% | -0.10% | -0.00% | 0.28% | 0.05% | -0.00% |
The heat map shows percentage changes of major currencies against each other. The base currency is picked from the left column, while the quote currency is picked from the top row. For example, if you pick the Canadian Dollar from the left column and move along the horizontal line to the US Dollar, the percentage change displayed in the box will represent CAD (base)/USD (quote).
Author

Akhtar Faruqui
FXStreet
Akhtar Faruqui is a Forex Analyst based in New Delhi, India. With a keen eye for market trends and a passion for dissecting complex financial dynamics, he is dedicated to delivering accurate and insightful Forex news and analysis.


