USD/CAD Price Forecast: Falls toward 50-day EMA near 1.4300
- USD/CAD may test its initial support at the 50-day EMA of 1.4306.
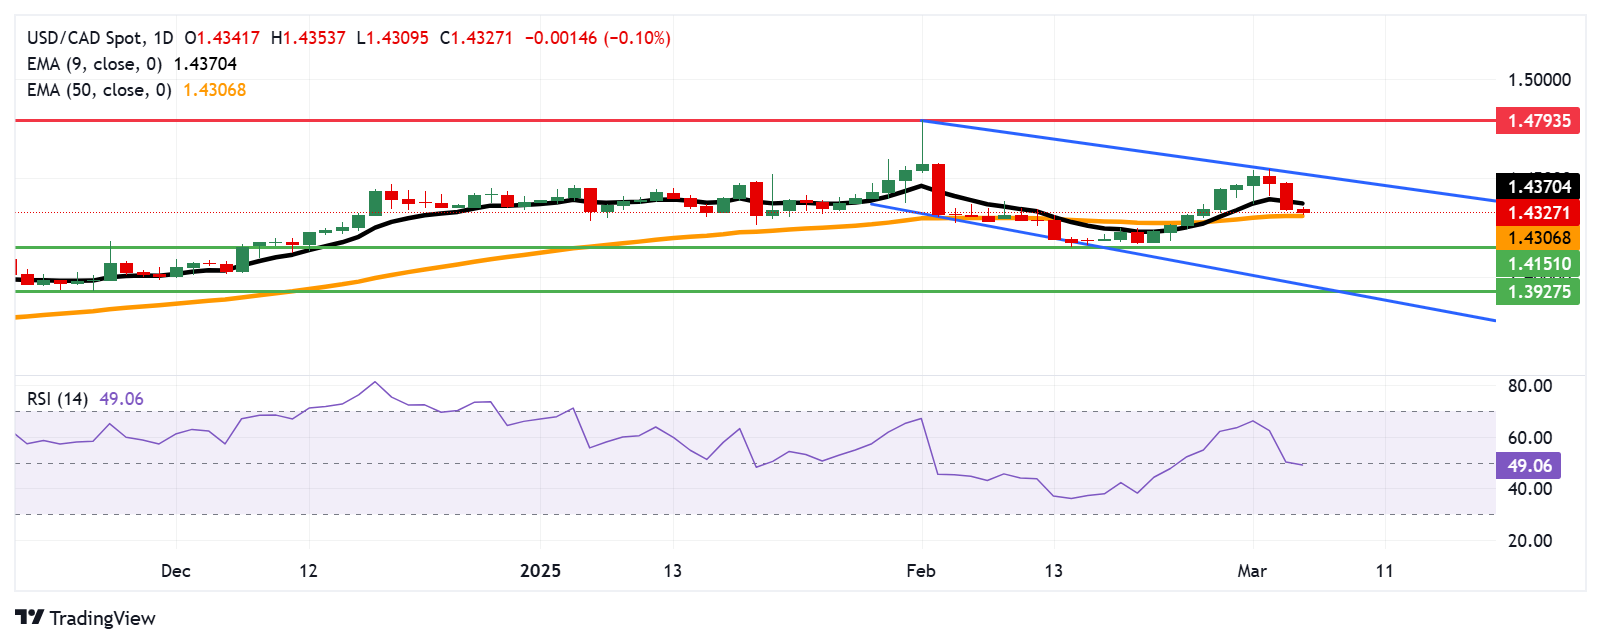
- The 14-day Relative Strength Index is slightly below 50, signaling a bearish outlook.
- Immediate resistance is seen at the nine-day EMA of 1.4371.

USD/CAD continues its losing streak for the third consecutive day, trading around 1.4330 during Thursday’s Asian session. Technical analysis on the daily chart suggests the pair remains within a descending channel pattern, reinforcing a bearish outlook.
The 14-day Relative Strength Index (RSI) sits just below 50, indicating a bearish sentiment. A continued decline could further validate the downside bias. Additionally, the USD/CAD pair remains below the nine-day Exponential Moving Average (EMA), signaling weaker short-term price momentum.
The initial support is located at the 50-day EMA of 1.4306, closely aligned with the psychological level of 1.4300. A decisive break below this key support zone could accelerate bearish momentum, potentially driving the USD/CAD pair toward the three-month low of 1.4151, last seen on February 14.
On the upside, the USD/CAD pair faces immediate resistance at the nine-day EMA of 1.4371, followed by the upper boundary of the descending channel near 1.4530. A breakout above this channel could weaken the bearish outlook, potentially opening the door for a rally toward 1.4793—the highest level since March 2003, recorded on February 3.
USD/CAD: Daily Chart
Canadian Dollar PRICE Today
The table below shows the percentage change of Canadian Dollar (CAD) against listed major currencies today. Canadian Dollar was the weakest against the New Zealand Dollar.
| USD | EUR | GBP | JPY | CAD | AUD | NZD | CHF | |
|---|---|---|---|---|---|---|---|---|
| USD | -0.12% | -0.00% | 0.18% | -0.10% | -0.09% | -0.13% | 0.04% | |
| EUR | 0.12% | 0.12% | 0.31% | 0.03% | 0.04% | -0.01% | 0.16% | |
| GBP | 0.00% | -0.12% | 0.21% | -0.10% | -0.08% | -0.12% | 0.04% | |
| JPY | -0.18% | -0.31% | -0.21% | -0.29% | -0.27% | -0.35% | -0.14% | |
| CAD | 0.10% | -0.03% | 0.10% | 0.29% | 0.03% | -0.03% | 0.14% | |
| AUD | 0.09% | -0.04% | 0.08% | 0.27% | -0.03% | -0.05% | 0.12% | |
| NZD | 0.13% | 0.01% | 0.12% | 0.35% | 0.03% | 0.05% | 0.18% | |
| CHF | -0.04% | -0.16% | -0.04% | 0.14% | -0.14% | -0.12% | -0.18% |
The heat map shows percentage changes of major currencies against each other. The base currency is picked from the left column, while the quote currency is picked from the top row. For example, if you pick the Canadian Dollar from the left column and move along the horizontal line to the US Dollar, the percentage change displayed in the box will represent CAD (base)/USD (quote).
Author

Akhtar Faruqui
FXStreet
Akhtar Faruqui is a Forex Analyst based in New Delhi, India. With a keen eye for market trends and a passion for dissecting complex financial dynamics, he is dedicated to delivering accurate and insightful Forex news and analysis.


