USD/CAD Price Forecast: Falls toward 1.3500; next support at lower boundary of the pattern
- The USD/CAD pair could potentially resume its upward movement as a falling wedge pattern suggests a bullish reversal signal.
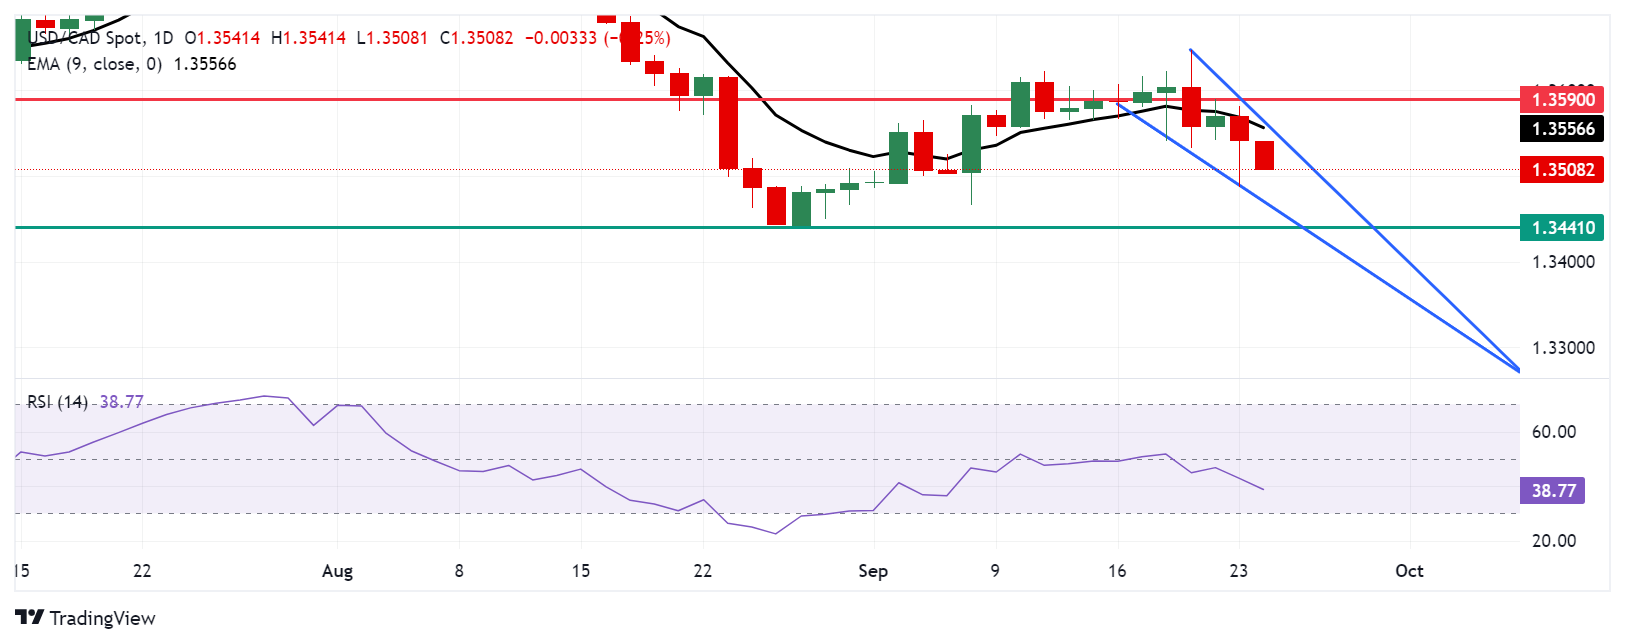
- A break below the psychological 1.3500 level could lead the pair to test the lower boundary of the falling wedge.
- The immediate barrier appears at the nine-day EMA at 1.3557 level, aligned with the upper boundary of the falling wedge.

USD/CAD extends its losses for the second successive day, trading around 1.3510 during Tuesday’s European hours. Analysis of the daily chart suggests a continuation signal, as the falling wedge pattern is formed during an uptrend, implying that the upward price action would resume.
However, the 14-day Relative Strength Index (RSI) remains below the 50 level, indicating that the bearish trend is still in effect. A further decline toward the 30 mark would suggest an oversold condition for the USD/CAD pair, signaling the potential for an upward correction in the near future.
On the downside, the USD/CAD may navigate the region around the lower boundary of the falling wedge at 1.3470. A break below this level could strengthen the bearish bias and push the pair to test the six-month low of 1.3441 level, recorded on August 28.
Regarding the upside, the immediate barrier appears at the nine-day EMA at 1.3557 level, aligned with the upper boundary of the falling wedge. A breach above the falling wedge would weaken the bearish bias and lead the pair to the USD/CAD pair to test the "throwback support turns into a pullback resistance" level of 1.3590, followed by the psychological level of 1.3600.
USD/CAD: Daily Chart
(This story was corrected on September 24 at 09:00 GMT to say, in the second paragraph, that a further decline toward the 30 mark, not 40.)
Canadian Dollar PRICE Today
The table below shows the percentage change of Canadian Dollar (CAD) against listed major currencies today. Canadian Dollar was the weakest against the Euro.
| USD | EUR | GBP | JPY | CAD | AUD | NZD | CHF | |
|---|---|---|---|---|---|---|---|---|
| USD | -0.23% | -0.11% | 0.61% | -0.23% | 0.03% | -0.03% | 0.00% | |
| EUR | 0.23% | 0.13% | 0.82% | -0.04% | 0.25% | 0.19% | 0.23% | |
| GBP | 0.11% | -0.13% | 0.71% | -0.13% | 0.14% | 0.06% | 0.11% | |
| JPY | -0.61% | -0.82% | -0.71% | -0.80% | -0.58% | -0.66% | -0.59% | |
| CAD | 0.23% | 0.04% | 0.13% | 0.80% | 0.26% | 0.20% | 0.25% | |
| AUD | -0.03% | -0.25% | -0.14% | 0.58% | -0.26% | -0.06% | -0.02% | |
| NZD | 0.03% | -0.19% | -0.06% | 0.66% | -0.20% | 0.06% | 0.06% | |
| CHF | -0.00% | -0.23% | -0.11% | 0.59% | -0.25% | 0.02% | -0.06% |
The heat map shows percentage changes of major currencies against each other. The base currency is picked from the left column, while the quote currency is picked from the top row. For example, if you pick the Canadian Dollar from the left column and move along the horizontal line to the US Dollar, the percentage change displayed in the box will represent CAD (base)/USD (quote).
Author

Akhtar Faruqui
FXStreet
Akhtar Faruqui is a Forex Analyst based in New Delhi, India. With a keen eye for market trends and a passion for dissecting complex financial dynamics, he is dedicated to delivering accurate and insightful Forex news and analysis.


