|

USD/CAD Price Analysis: The price is taking on critical time-frame levels in the volatility

  • USD/CAD bears are seeking an hourly downside extension.
  • USD/CAD bulls are lurking at the daily support near 1.2750. 

USD/CAD is attempting to break lower in US trade on Thursday. However, as illustrated in the following charting analysis, there are critical areas of resistance and support to keep in mind, as well as reversion patterns. 

USD/CAD 1H chart

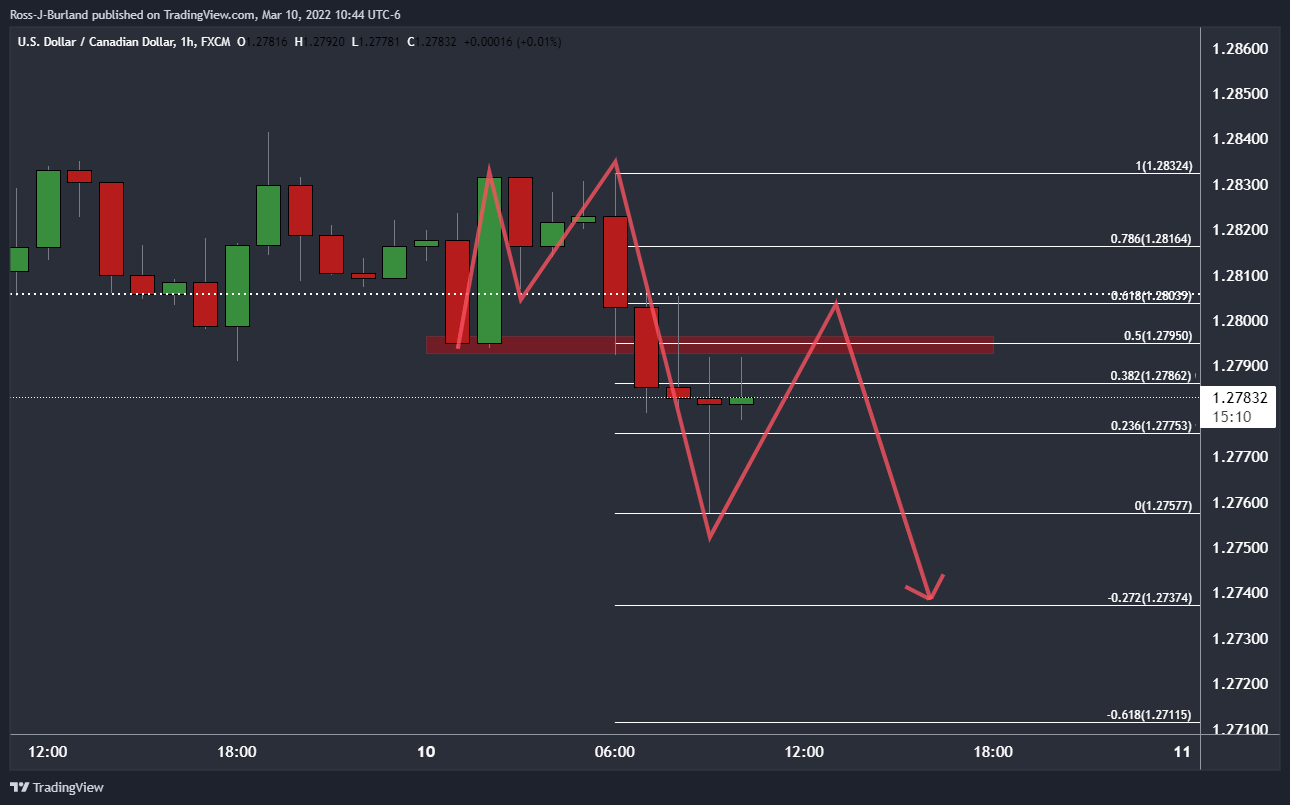
On the hourly chart, there is an M-formation that is playing out. The price would be expected to be hamstrung to the prior support being the neckline of the M-pattern. However, it is an overextended M-formation, so the reversion may only get as far as the last support near 1.2795.

The wicks of recent hourly candles within the bearish impulses have come close already. Therefore, an hourly close below 1.2770 could be seen to nullify the reversion pattern, and the focus will be on the downside. 1.2770 is a significant level as it is -61.8% of the length of the initial bullish leg of the M-formation.

USD/CAD daily chart

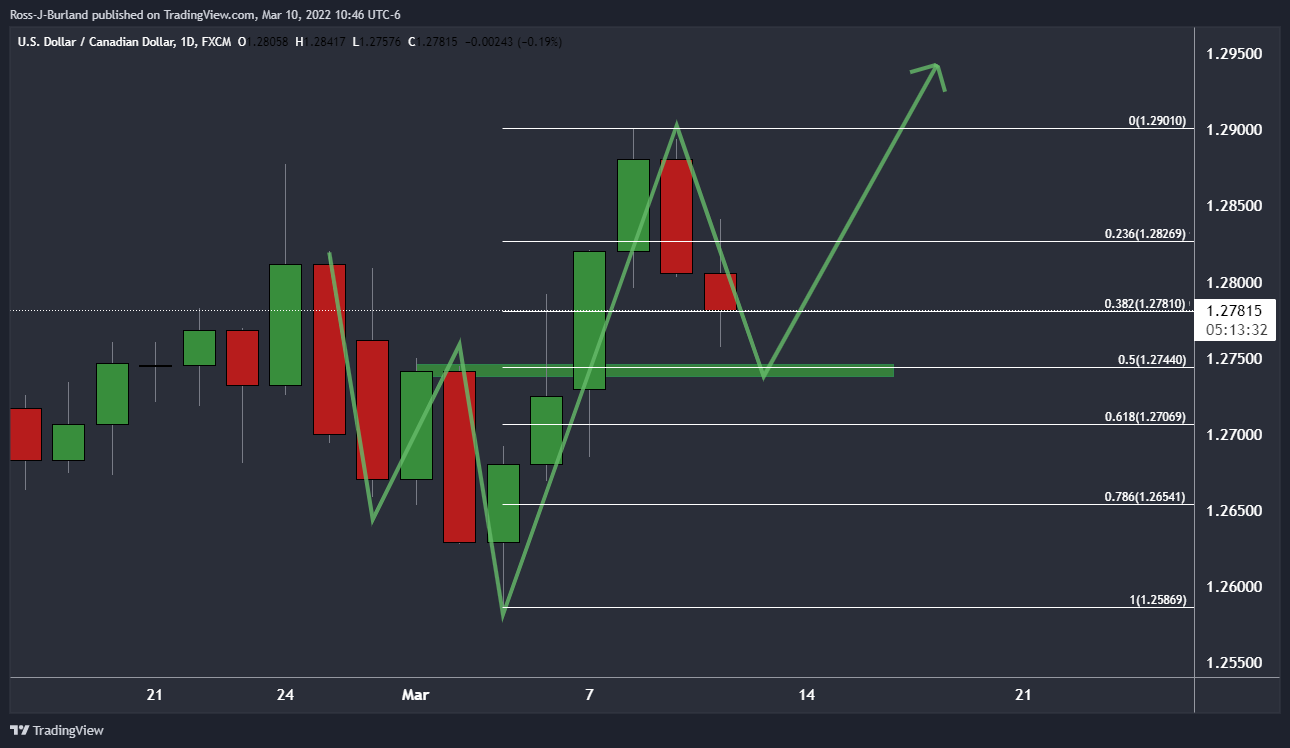
Meanwhile, from a longer-term perspective, the daily chart is showing that the price is running towards the neckline of the W-formation, as illustrated in the above chart. From there, should demand move in, then a bullish continuation could be on the cards for the foreseeable future. 

Author

Ross J Burland

Ross J Burland, born in England, UK, is a sportsman at heart. He played Rugby and Judo for his county, Kent and the South East of England Rugby team.

More from Ross J Burland
Share:

Editor's Picks

EUR/USD eyes nine-day EMA barrier after rebounding from 1.1600

EUR/USD gains ground after registering modest losses in the previous session, trading around 1.1620 during the Asian hours on Friday. The technical analysis of the daily chart suggests an ongoing bearish bias as the pair remains within the descending channel pattern.

GBP/USD drifts lower heading into NFP range

GBP/USD edged lower by 0.2% on Thursday, settling close to 1.3350 in a strained trading session that kept the pair pinned near three-month lows. Price briefly recovered earlier in the day on reports that Iran had indirectly signaled openness to talks with the CIA, but the bounce faded as Israeli officials reportedly advised Washington to disregard the overture. 

Gold awaits US Nonfarm Payrolls for a clear directional impetus

Gold rebounds above $5,100 early Friday after testing the $5,050 level amid global sell-off. The US Dollar pulls back as profit-taking creeps in ahead of US labor data. For February. 21-day SMA holds amid bullish RSI; a daily closing above 61.8% Fibo is critical for Gold buyers.

Ethereum pull in $169M as validators pile in to stake ETH

US spot Ethereum exchange-traded funds recorded $169 million in net inflows on Wednesday, marking the largest daily intake in two months, according to SoSoValue data. The rise in inflows signals renewed institutional interest in Ethereum amid broader market volatility.

The market compass is pointing at a barrel of Oil

The Asian open is arriving with equities leaning the wrong way, and the reason is not complicated. The market’s compass needle has snapped firmly toward crude. In this tape, oil is not just another input price; it is the gravitational center around which every asset class is orbiting.

Ripple tests recovery strength amid steady ETF inflows, growing retail interest

Ripple (XRP) continues to demonstrate notable resilience as the cryptocurrency market navigates the persistent war in the Middle East after the United States (US) and Israel attacked Iran on Saturday.