USD/CAD Price Analysis: Sticks to modest intraday gains above 1.3700, lacks bullish conviction
- USD/CAD attracts fresh buyers on Wednesday and draws support from a combination of factors.
- Softer Canadian CPI undermines the Loonie and acts as a tailwind amid a modest USD strength.
- The mixed technical setup warrants caution before positioning for a firm near-term direction.

The USD/CAD pair regains positive traction on Wednesday and holds its neck above the 1.3700 round-figure mark through the first half of the European session.
The Canadian Dollar (CAD) is undermined by softer domestic consumer inflation figures released on Tuesday, which now seem to have dashed hopes for any further rate hikes by the Bank of Canada (BoC). The US Dollar (USD), on the other hand, is seen building on the previous day's hawkish FOMC minutes-inspired recovery move from its lowest level since August 31 and acting as a tailwind for the USD/CAD pair. Meanwhile, subdued action around Crude Oil prices does little to provide any meaningful impetus to the commodity-linked Loonie.
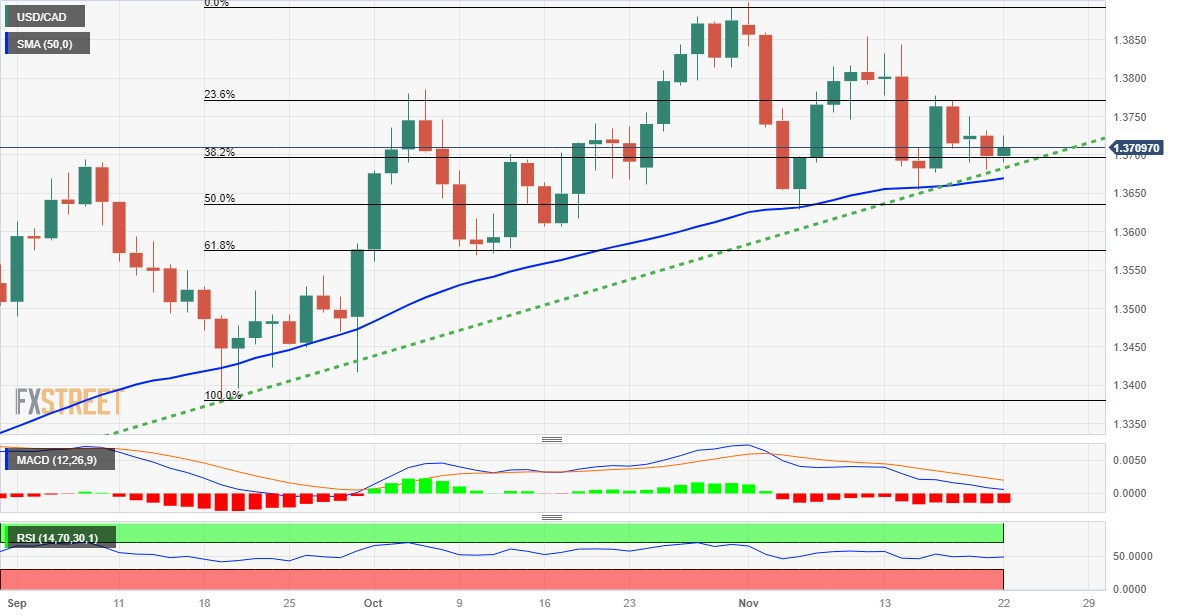
From a technical perspective, spot prices, so far, have been showing resilience below the 38.2% Fibonacci retracement level of the September-November rally and finding some support near a two-month-old ascending trend line. The latter is near the 50-day Simple Moving Average (SMA), around the 1.3670-1.3665 region, which should now act as a key pivotal point and determine the near-term trajectory for the USD/CAD pair.
With oscillators on the daily chart starting to gain some negative traction, a convincing break below the 50-day SMA will be seen as a fresh trigger for bearish traders and pave the way for some meaningful downside. The USD/CAD pair might then weaken further below the 50% Fibo. level, around the 1.3640-1.3635 region, and accelerate the slide towards the 1.3600 mark en route to the 1.3580-1.3575 zone, or 61.8% Fibo. level.
On the flip side, any subsequent move-up is likely to confront some resistance near the weekly swing high, around the 1.3750 area ahead of the 1.3775 region, or the 23.6% Fibo. level. Some follow-through buying will negate any near-term negative bias and allow the USD/CAD pair to reclaim the 1.3800 mark. The momentum could get extended further towards the 1.3835-1.3840 supply zone and the YTD peak, near the 1.3900 level.
USD/CAD daily chart
Technical levels to watch
Author

Haresh Menghani
FXStreet
Haresh Menghani is a detail-oriented professional with 10+ years of extensive experience in analysing the global financial markets.


