USD/CAD Price Analysis: Stays defensive above 50-SMA support


  • USD/CAD licks its wounds after the biggest daily loss in over a week.
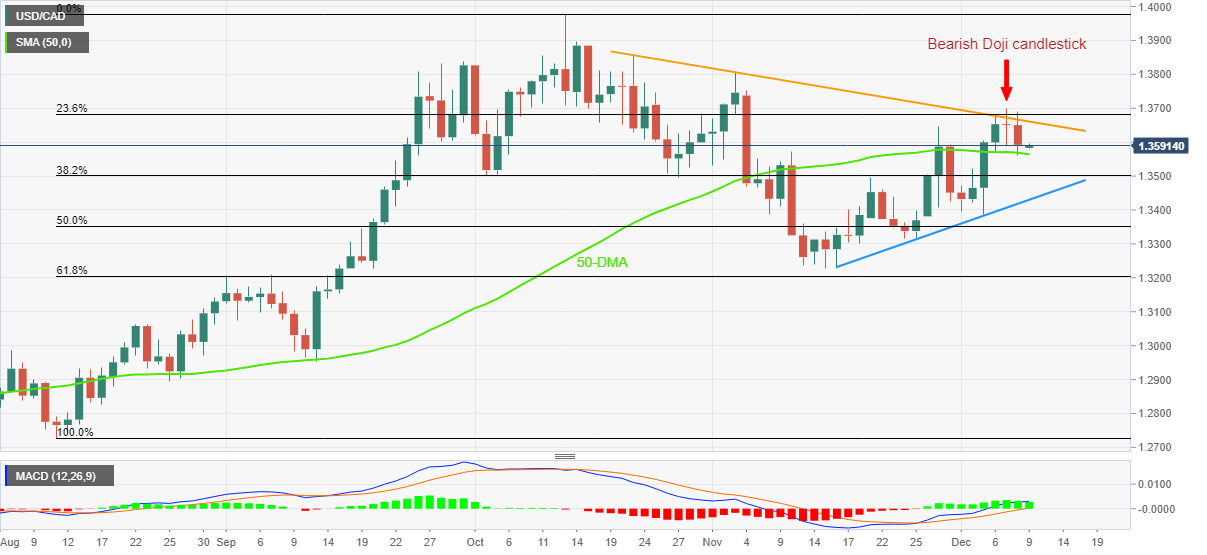
  • 50-DMA restricts immediate downside but bearish Doji candlestick, seven-week-old resistance line probe bulls.
  • Ascending trend line from mid-November puts a strong floor under the prices.

USD/CAD seesaws around 1.3600 as bearish take a breather during early Friday morning in Asia, after the heaviest slump in eight days.

The Loonie pair’s previous fall could be linked to the bearish Doji candlestick, as well as the U-turn from the seven-week-old downward-sloping resistance line.

However, the bullish MACD signals and the 50-DMA level surrounding 1.3560 challenge the quote’s immediate downside.

In a case where the USD/CAD bears manage to conquer the 50-DMA support, the 38.2% Fibonacci retracement level of the pair’s August-October upside, near 1.3500 threshold, will be on their radars.

Even so, the pair buyers remain hopeful unless witnessing a clear downside break of an ascending support line from the mid-November, at 1.3430 by the press time.

Meanwhile, recovery moves not only need to cross the aforementioned nearby resistance line figures of 1.3665 but also cross the stated Doji’s top of 1.3700 to convince USD/CAD buyers.

Following that, a quick run-up towards the previous monthly peak surrounding 1.3810 can’t be ruled out.

Though, multiple levels surrounding 1.3850 and 1.3900 can test the USD/CAD bulls afterward, before directing them to the yearly high marked in October near 1.3980.

USD/CAD: Daily chart

Trend: Limited downside expected

Additional important levels

Overview
Today last price 1.3591
Today Daily Change -0.0060
Today Daily Change % -0.44%
Today daily open 1.3651
 
Trends
Daily SMA20 1.3422
Daily SMA50 1.3571
Daily SMA100 1.3316
Daily SMA200 1.3044
 
Levels
Previous Daily High 1.37
Previous Daily Low 1.3589
Previous Weekly High 1.3646
Previous Weekly Low 1.3381
Previous Monthly High 1.3808
Previous Monthly Low 1.3226
Daily Fibonacci 38.2% 1.3632
Daily Fibonacci 61.8% 1.3658
Daily Pivot Point S1 1.3593
Daily Pivot Point S2 1.3536
Daily Pivot Point S3 1.3483
Daily Pivot Point R1 1.3704
Daily Pivot Point R2 1.3758
Daily Pivot Point R3 1.3815


Share: Feed news

Information on these pages contains forward-looking statements that involve risks and uncertainties. Markets and instruments profiled on this page are for informational purposes only and should not in any way come across as a recommendation to buy or sell in these assets. You should do your own thorough research before making any investment decisions. FXStreet does not in any way guarantee that this information is free from mistakes, errors, or material misstatements. It also does not guarantee that this information is of a timely nature. Investing in Open Markets involves a great deal of risk, including the loss of all or a portion of your investment, as well as emotional distress. All risks, losses and costs associated with investing, including total loss of principal, are your responsibility. The views and opinions expressed in this article are those of the authors and do not necessarily reflect the official policy or position of FXStreet nor its advertisers. The author will not be held responsible for information that is found at the end of links posted on this page.

If not otherwise explicitly mentioned in the body of the article, at the time of writing, the author has no position in any stock mentioned in this article and no business relationship with any company mentioned. The author has not received compensation for writing this article, other than from FXStreet.

FXStreet and the author do not provide personalized recommendations. The author makes no representations as to the accuracy, completeness, or suitability of this information. FXStreet and the author will not be liable for any errors, omissions or any losses, injuries or damages arising from this information and its display or use. Errors and omissions excepted.

The author and FXStreet are not registered investment advisors and nothing in this article is intended to be investment advice.

Recommended content


Recommended content

Editors’ Picks

EUR/USD now refocuses on the 200-day SMA

EUR/USD now refocuses on the 200-day SMA

EUR/USD extended its positive momentum and rose above the 1.0700 yardstick, driven by the intense PMI-led retracement in the US Dollar as well as a prevailing risk-friendly environment in the FX universe.

EUR/USD News

GBP/USD extends recovery beyond 1.2400 on broad USD weakness

GBP/USD extends recovery beyond 1.2400 on broad USD weakness

GBP/USD gathered bullish momentum and extended its daily rebound toward 1.2450 in the second half of the day. The US Dollar came under heavy selling pressure after weaker-than-forecast PMI data and fueled the pair's rally. 

GBP/USD News

Gold struggles around $2,325 despite broad US Dollar’s weakness

Gold struggles around $2,325 despite broad US Dollar’s weakness

Gold reversed its direction and rose to the $2,320 area, erasing a large portion of its daily losses in the process. The benchmark 10-year US Treasury bond yield stays in the red below 4.6% following the weak US PMI data and supports XAU/USD.

Gold News

Bitcoin price makes run for previous cycle highs as Morgan Stanley pushes BTC ETF exposure

Bitcoin price makes run for previous cycle highs as Morgan Stanley pushes BTC ETF exposure

Bitcoin (BTC) price strength continues to grow, three days after the fourth halving. Optimism continues to abound in the market as Bitcoiners envision a reclamation of previous cycle highs.

Read more

Germany’s economic come back

Germany’s economic come back

Germany is the sick man of Europe no more. Thanks to its service sector, it now appears that it will exit recession, and the economic future could be bright. The PMI data for April surprised on the upside for Germany, led by the service sector.

Read more

Forex MAJORS

Cryptocurrencies

Signatures