|

USD/CAD Price Analysis: Shows signs of recovery, trades above the 200-DMA

  • USD/CAD rises above the 200-day EMA but struggles to crack 1.3400.
  • Upside risks for the USD/CAD lie above 1.3400, which can trigger a rally toward 1.3500.
  • USD/CAD failure to crack 1.3400 could pave the way for further losses.

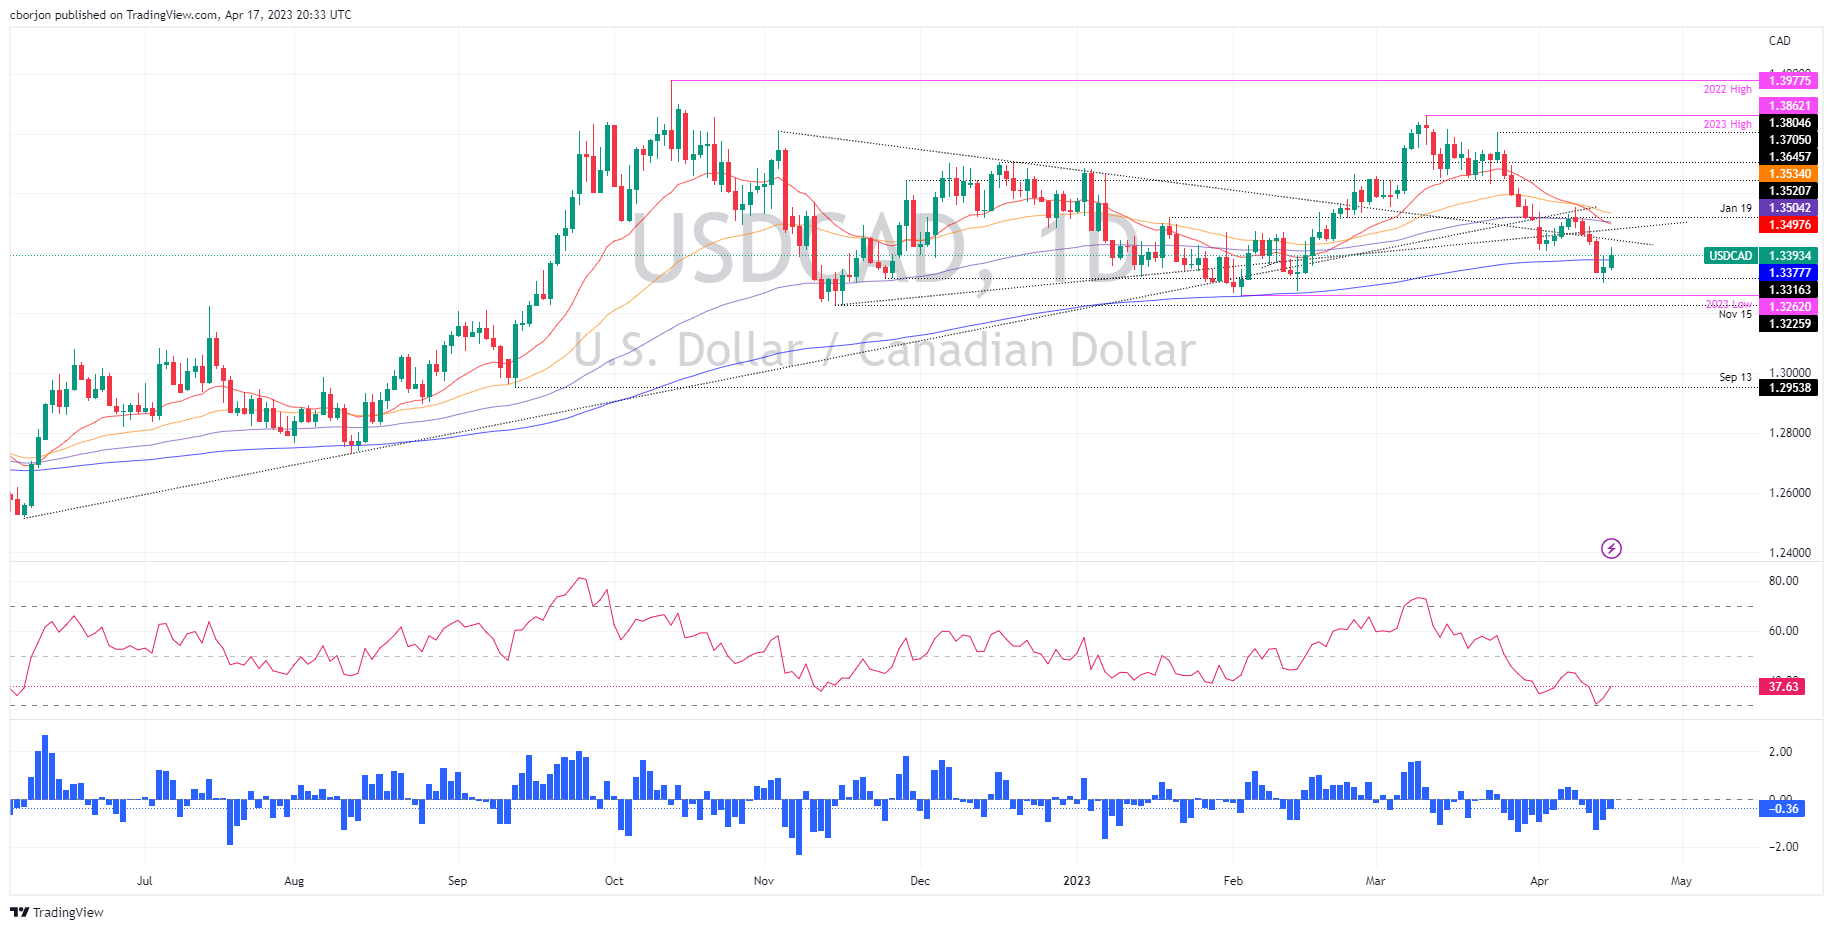
The USD/CAD advances after bottoming last Friday at around 1.3300; the pair bounces off and hovers nearby the 1.3400 figure after reaching a high of 1.3420. At the time of writing, the USD/CAD is trading at 1.3395 and is gaining 0.31%.

The USD/CAD dove to new 8-week lows at 1.3300, spurring an increase in the greenback’s demand, even though the Bank of Canada (BoC), in its latest monetary policy, announced the BoC Governing Council discussed raising rates. Nevertheless, current expectations for additional Fed tightening bolstered the US Dollar.

USD/CAD Price Action

Given the backdrop, the USD/CAD is still neutral to downward biased, but it’s testing the upper boundaries of the 200-day Exponential Moving Average (EMA) at 1.3377. In addition, a daily close of the USD/CAD pair above the latter could exacerbate another leg-up in the pair, initially towards a downslope resistance trendline drawn from November 2022 highs that pass around the 1.3430-50 area. But firstly, the USD/CAD buyers need to reclaim 1.3400.

If USD/CAD cracks the 1.3400 figure, the next resistance would be the trendline mentioned above at 1.3430-50. Once cleared, the USD/CAD could threaten the confluence of the 20 and 100-day EMAs, around 1.3497-1.3504, before rallying towards the 50-day EMA At 1.3534.

Conversely, if USD/CAD stays below 1.3400, that could open the door for further downside. That said, the first support would be the 200-day EMA at 1.3377, followed by the April 17 low at 1.3342, before aiming toward the 1.3300 figure.

USD/CAD Daily Chart

USD/CAD Daily Chart

USD/CAD Technical Levels

USD/CAD

Overview
Today last price1.3395
Today Daily Change0.0024
Today Daily Change %0.18
Today daily open1.3371
 
Trends
Daily SMA201.3545
Daily SMA501.3563
Daily SMA1001.3531
Daily SMA2001.3401
 
Levels
Previous Daily High1.3396
Previous Daily Low1.3301
Previous Weekly High1.3554
Previous Weekly Low1.3301
Previous Monthly High1.3862
Previous Monthly Low1.3508
Daily Fibonacci 38.2%1.336
Daily Fibonacci 61.8%1.3337
Daily Pivot Point S11.3316
Daily Pivot Point S21.3262
Daily Pivot Point S31.3222
Daily Pivot Point R11.3411
Daily Pivot Point R21.345
Daily Pivot Point R31.3505

Author

Christian Borjon Valencia

Christian Borjon began his career as a retail trader in 2010, mainly focused on technical analysis and strategies around it. He started as a swing trader, as he used to work in another industry unrelated to the financial markets.

More from Christian Borjon Valencia
Share:

Markets move fast. We move first.

Orange Juice Newsletter brings you expert driven insights - not headlines. Every day on your inbox.

By subscribing you agree to our Terms and conditions.

Editor's Picks

EUR/USD moves sideways below 1.1800 on Christmas Eve

EUR/USD struggles to find direction and trades in a narrow channel below 1.1800 after posting gains for two consecutive days. Bond and stock markets in the US will open at the usual time and close early on Christmas Eve, allowing the trading action to remain subdued. 

GBP/USD keeps range around 1.3500 amid quiet markets

GBP/USD keeps its range trade intact at around 1.3500 on Wednesday. The Pound Sterling holds the upper hand over the US Dollar amid pre-Christmas light trading as traders move to the sidelines heading into the holiday season. 

Gold retreats from record highs, trades below $4,500

Gold retreats after setting a new record-high above $4,520 earlier in the day and trades in a tight range below $4,500 as trading volumes thin out ahead of the Christmas break. The US Dollar selling bias remains unabated on the back of dovish Fed expectations, which continues to act as a tailwind for the bullion amid persistent geopolitical risks.

Bitcoin slips below $87,000 as ETF outflows intensify, whale participation declines

Bitcoin price continues to trade around $86,770 on Wednesday, after failing to break above the $90,000 resistance. US-listed spot ETFs record an outflow of $188.64 million on Tuesday, marking the fourth consecutive day of withdrawals.

Economic outlook 2026-2027 in advanced countries: Solidity test

After a year marked by global economic resilience and ending on a note of optimism, 2026 looks promising and could be a year of solid economic performance. In our baseline scenario, we expect most of the supportive factors at work in 2025 to continue to play a role in 2026.

Avalanche struggles near $12 as Grayscale files updated form for ETF

Avalanche trades close to $12 by press time on Wednesday, extending the nearly 2% drop from the previous day. Grayscale filed an updated form to convert its Avalanche-focused Trust into an ETF with the US Securities and Exchange Commission.