USD/CAD Price Analysis: Seesaws between 61.8% Fibonacci retracement, 100-day EMA


  • USD/CAD steps back from 100-day EMA, still positive on a day above the weekly low of 1.3728.
  • 200-day EMA offers additional support below 61.8% Fibonacci retracement.
  • May 19 low, 50% Fibonacci retracement can challenge the buyers.

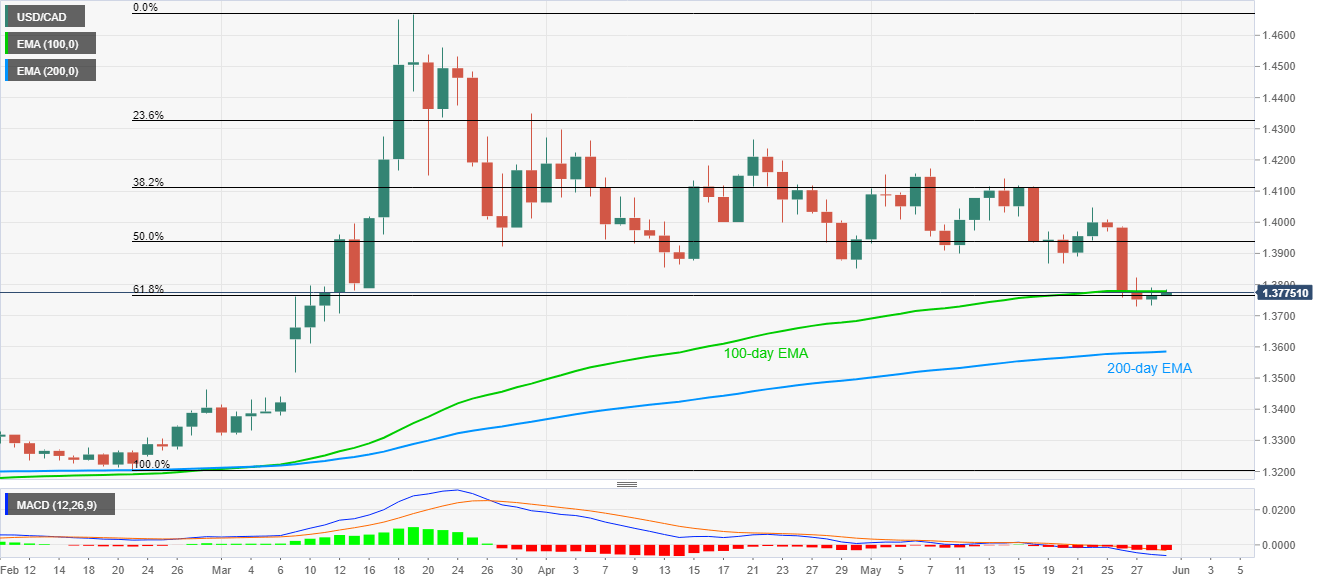
USD/CAD drops from the intraday high of 1.3785 to 1.3773 amid the initial hour of Tokyo trading on Friday. In doing so, the pair retreats from 100-day EMA but stays above 61.8% Fibonacci retracement level of February-March upside.

Even so, the bearish MACD and a failure to carry the bounce off 1.3728 favors the sellers.

As a result, odds of the pair’s drop to a 200-day EMA level of 1.3585 become brighter if it breaks the immediate supports surrounding 1.3765 and 1.3730.

On the contrary, an upside clearance of a 100-day EMA level of 1.3780 might not help the bulls regain the throne as May 19 low near 1.3865/70 and 50% Fibonacci retracement level of 1.3940 stand all as near-term key resistances.

USD/CAD daily chart

Trend: Bearish

Additional important levels

Overview
Today last price 1.3774
Today Daily Change 11 pips
Today Daily Change % 0.08%
Today daily open 1.3763
 
Trends
Daily SMA20 1.3982
Daily SMA50 1.405
Daily SMA100 1.3712
Daily SMA200 1.3456
 
Levels
Previous Daily High 1.379
Previous Daily Low 1.3734
Previous Weekly High 1.4114
Previous Weekly Low 1.3867
Previous Monthly High 1.4299
Previous Monthly Low 1.385
Daily Fibonacci 38.2% 1.3769
Daily Fibonacci 61.8% 1.3755
Daily Pivot Point S1 1.3735
Daily Pivot Point S2 1.3707
Daily Pivot Point S3 1.3679
Daily Pivot Point R1 1.3791
Daily Pivot Point R2 1.3818
Daily Pivot Point R3 1.3846


Share: Feed news

Information on these pages contains forward-looking statements that involve risks and uncertainties. Markets and instruments profiled on this page are for informational purposes only and should not in any way come across as a recommendation to buy or sell in these assets. You should do your own thorough research before making any investment decisions. FXStreet does not in any way guarantee that this information is free from mistakes, errors, or material misstatements. It also does not guarantee that this information is of a timely nature. Investing in Open Markets involves a great deal of risk, including the loss of all or a portion of your investment, as well as emotional distress. All risks, losses and costs associated with investing, including total loss of principal, are your responsibility. The views and opinions expressed in this article are those of the authors and do not necessarily reflect the official policy or position of FXStreet nor its advertisers. The author will not be held responsible for information that is found at the end of links posted on this page.

If not otherwise explicitly mentioned in the body of the article, at the time of writing, the author has no position in any stock mentioned in this article and no business relationship with any company mentioned. The author has not received compensation for writing this article, other than from FXStreet.

FXStreet and the author do not provide personalized recommendations. The author makes no representations as to the accuracy, completeness, or suitability of this information. FXStreet and the author will not be liable for any errors, omissions or any losses, injuries or damages arising from this information and its display or use. Errors and omissions excepted.

The author and FXStreet are not registered investment advisors and nothing in this article is intended to be investment advice.

Recommended content


Recommended content

Editors’ Picks

AUD/USD hovers around 0.6500 amid light trading, ahead of US GDP

AUD/USD hovers around 0.6500 amid light trading, ahead of US GDP

AUD/USD is trading close to 0.6500 in Asian trading on Thursday, lacking a clear directional impetus amid an Anzac Day holiday in Australia. Meanwhile, traders stay cautious due ti risk-aversion and ahead of the key US Q1 GDP release. 

AUD/USD News

USD/JPY finds its highest bids since 1990, near 155.50

USD/JPY finds its highest bids since 1990, near 155.50

USD/JPY keeps breaking into its highest chart territory since June of 1990 early Thursday, testing 155.50 for the first time in 34 years as the Japanese Yen remains vulnerable, despite looming Japanese intervention risks. Focus shifts to Thursday's US GDP report and the BoJ decision on Friday. 

USD/JPY News

Gold price treads water near $2,320, awaits US GDP data

Gold price treads water near $2,320, awaits US GDP data

Gold price recovers losses but keeps its range near $2,320 early Thursday. Renewed weakness in the US Dollar and the US Treasury yields allow Gold buyers to breathe a sigh of relief. Gold price stays vulnerable amid Middle East de-escalation, awaiting US Q1 GDP data. 

Gold News

Injective price weakness persists despite over 5.9 million INJ tokens burned

Injective price weakness persists despite over 5.9 million INJ tokens burned

Injective price is trading with a bearish bias, stuck in the lower section of the market range. The bearish outlook abounds despite the network's deflationary efforts to pump the price. Coupled with broader market gloom, INJ token’s doomed days may not be over yet.

Read more

Meta Platforms Earnings: META sinks 10% on lower Q2 revenue guidance Premium

Meta Platforms Earnings: META sinks 10% on lower Q2 revenue guidance

This must be "opposites" week. While Doppelganger Tesla rode horrible misses on Tuesday to a double-digit rally, Meta Platforms produced impressive beats above Wall Street consensus after the close on Wednesday, only to watch the share price collapse by nearly 10%.

Read more

Forex MAJORS

Cryptocurrencies

Signatures