|

USD/CAD Price Analysis: Potentially beginning new leg higher within range

  • USD/CAD is probably beginning a new up leg within a range. 
  • The MACD has crossed over its signal line adding further credence to the bullish thesis. 
  • A mini Bull Flag may also have formed at the range lows.
     

USD/CAD has been trading in a range since the start of May. At first it looked like the pair had formed a Symmetrical Triangle pattern but the pattern failed to evolve. 

The pair’s lack of directionality means the short-term trend is probably now sideways. Given the “trend is your friend” the odds favor a continuation of USD/CAD’s sideways oscillations.

USD/CAD 4-hour Chart 

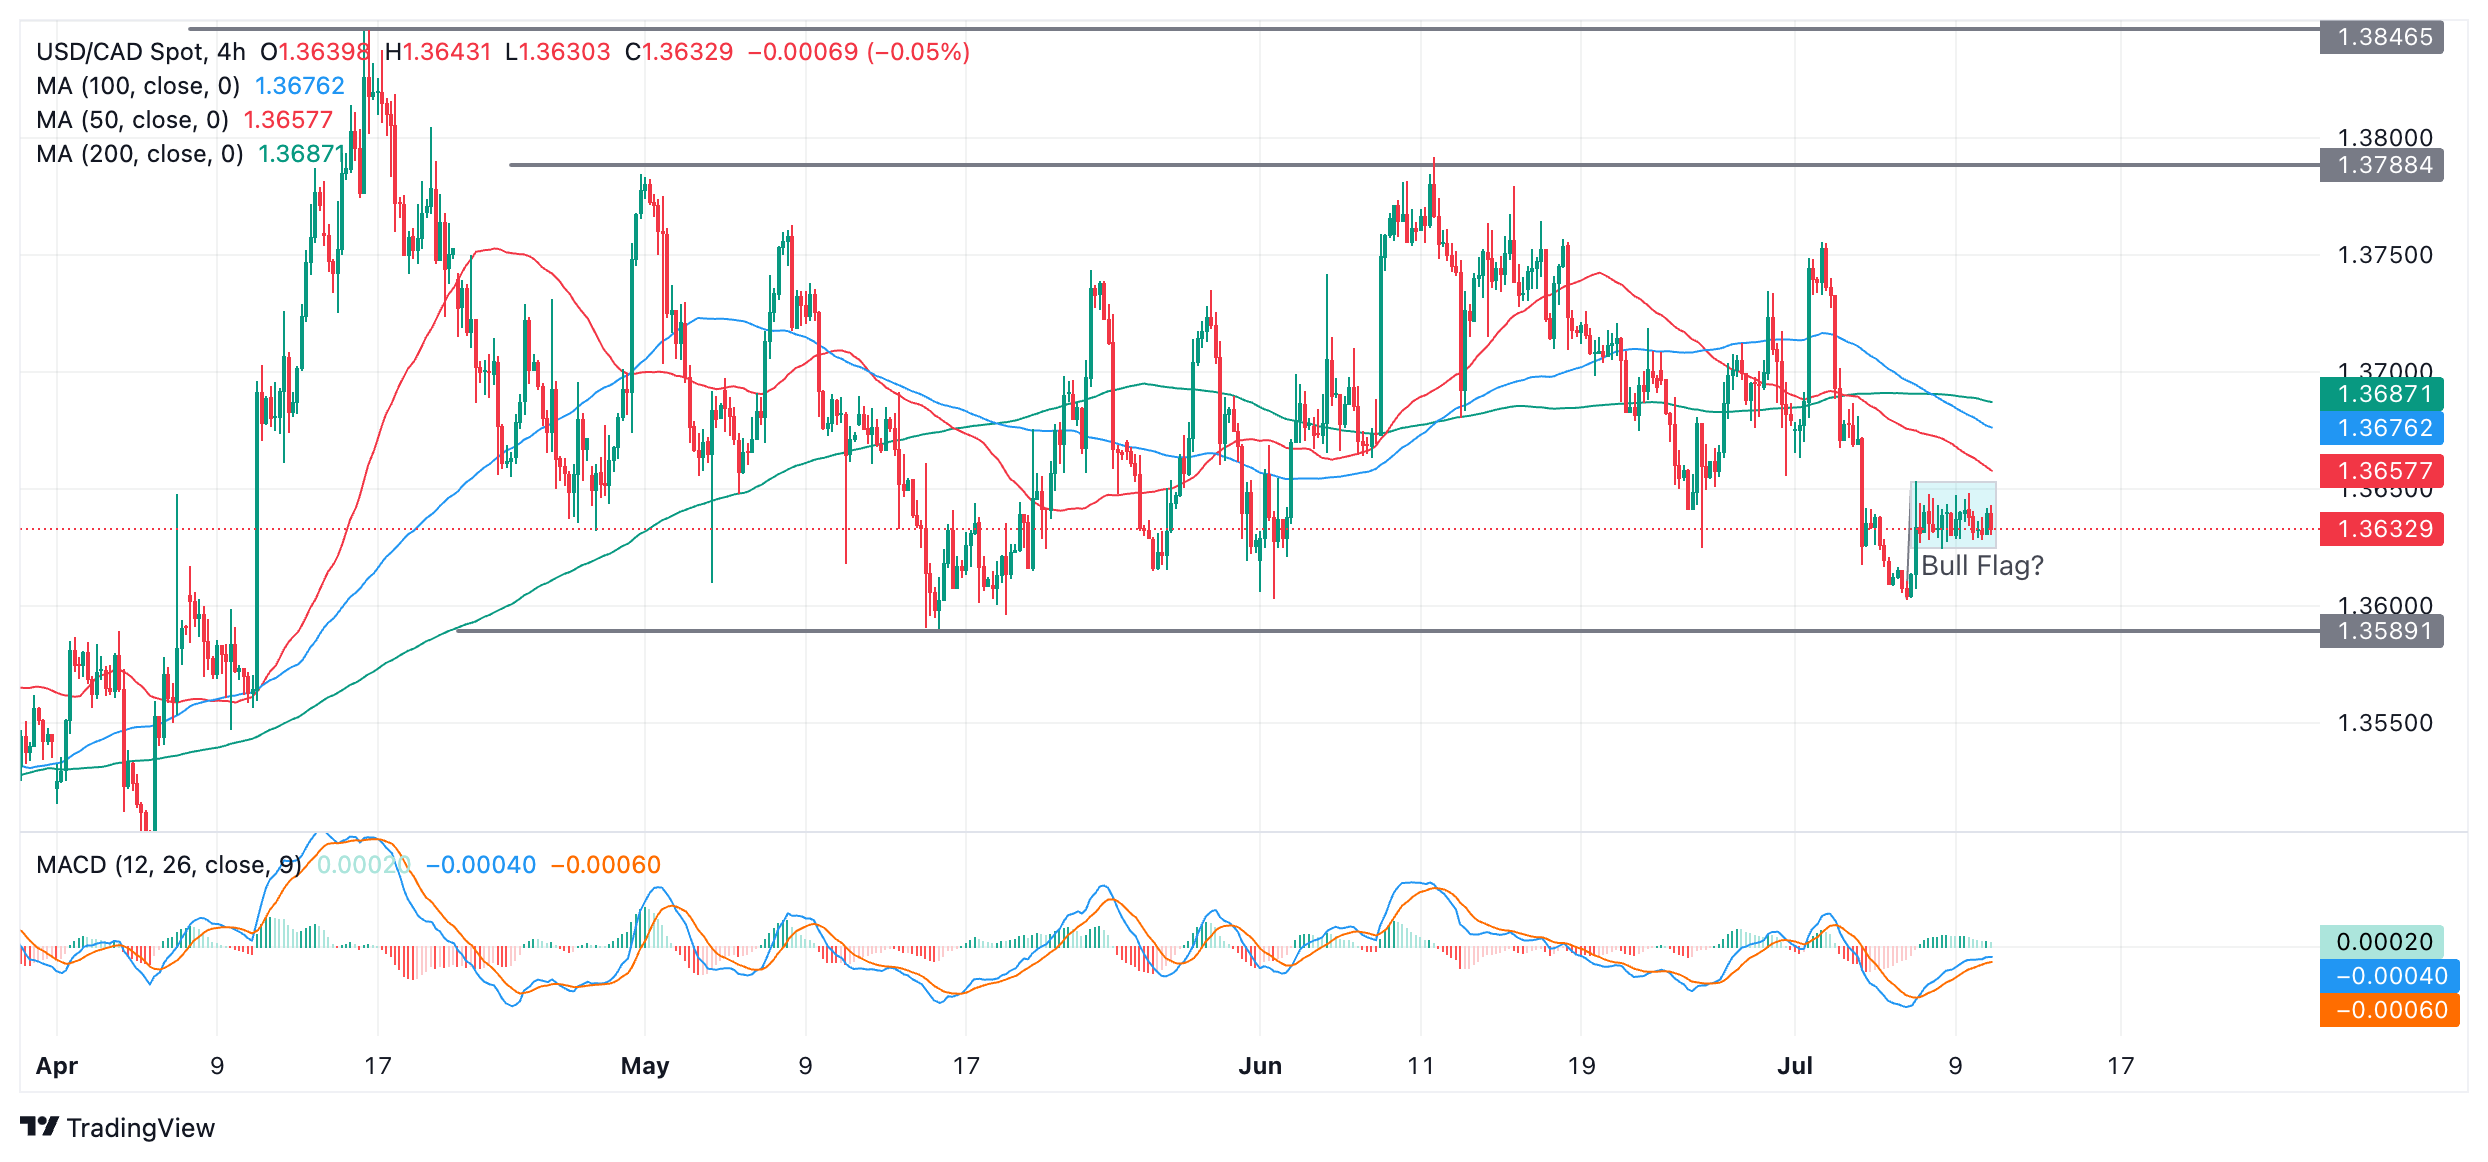
More recently USD/CAD has found support near the range’s floor at roughly 1.3589 and bounced. As it is in a sideways trend it will probably start moving up towards the range ceiling now at roughly 1.3788. 

The Moving Average Convergence Divergence (MACD) indicator crossed above its red signal line on July 5 after the initial bounce. This is a bullish sign and suggests the next leg higher within the range is about to unfold. Note how in the past, crossovers of the MACD and signal line coincided with price turns within the range.

USD/CAD has been trading in a mini-sideways consolidation (light blue shaded area on chart above) since July 5. This might be the “flag square” part of a small Bull Flag Pattern. Such a pattern promises further upside if price breaks out of the top of the rectangular consolidation phase. The target for the follow-through higher after the breakout is situated at 1.3764, the length of the initial bounce or “flag pole” extrapolated higher.

Author

Joaquin Monfort

Joaquin Monfort is a financial writer and analyst with over 10 years experience writing about financial markets and alt data. He holds a degree in Anthropology from London University and a Diploma in Technical analysis.

More from Joaquin Monfort
Share:

Editor's Picks

EUR/USD holds lower ground near 1.1850 ahead of EU/ US data

EUR/USD remains in the negative territory for the fourth successive session, trading around 1.1850 in European trading on Friday. A broadly cautious market environment paired with modest US Dollar demand undermines the pair ahead of the Eurozone GDP second estimate and the critical US CPI data. 

GBP/USD keeps losses around 1.3600, awaits US CPI for fresh impetus

GBP/USD holds moderate losses at around 1.3600 in the European session on Friday, though it lacks bearish conviction. The US Dollar remains supported amid softer risk tone and ahead of the US consumer inflation figures due later in the NA session on Friday. 

Gold trims intraday gains to $5,000 as US inflation data loom

Gold retreats from the vicinity of the $5,000 psychological mark, though sticks to its modest intraday gains heading into the European session. Traders now look forward to the release of the US consumer inflation figures for more cues about the Fed policy path. The outlook will play a key role in influencing the near-term US Dollar price dynamics and provide some meaningful impetus to the non-yielding bullion.

US CPI data set to show modest inflation cooling as markets price in a more hawkish Fed

The US Bureau of Labor Statistics will publish January’s Consumer Price Index data on Friday, delayed by the brief and partial United States government shutdown. The report is expected to show that inflationary pressures eased modestly but also remained above the Federal Reserve’s 2% target.

A tale of two labour markets: Headline strength masks underlying weakness

Undoubtedly, yesterday’s delayed US January jobs report delivered a strong headline – one that surpassed most estimates. However, optimism quickly faded amid sobering benchmark revisions.

Solana Price Forecast: Mixed market sentiment caps recovery

Solana (SOL) is trading at $79 as of Friday, following a correction of over 9% so far this week. On-chain and derivatives data indicates mixed sentiment among traders, further limiting the chances of a price recovery.