|

USD/CAD Price Analysis: Pierces 200-DMA, key resistance line as Canada Inflation, Fed Minutes loom

  • USD/CAD takes the bids to refresh intraday high, jostles with crucial resistances.
  • Bullish MACD signals, sustained upside break of four-month-old rising trend line favor Loonie pair buyers.
  • Sellers need validation from April’s low to retake control.

USD/CAD crosses the 200-DMA hurdle as bulls attack the five-month-old descending resistance line early Monday in Europe. In doing so, the Loonie pair justifies the retreat in the WTI crude oil prices, Canada’s key export item, while taking clues from the firmer US Treasury bond yields and the US Dollar amid sour sentiment. That said, the major currency pair rises 0.11% intraday to near 1.3460 by the press time.

Also read: USD/CAD holds ground near the 1.3440 mark, eyes on Canadian CPI, US Retail Sales

Apart from the aforementioned fundamentals, a successful break of the rising trend line from April 14, close to 1.3400, joins the bullish MACD signals to keep the USD/CAD buyers hopeful.

However, a daily closing beyond the stated resistance line, close to 1.3460 at the latest, becomes necessary for the Loonie pair buyers to keep the reins.

Also likely to challenge the USD/CAD buyers is the monthly high of near 1.3500, a break of which could propel the prices toward a horizontal area comprising multiple tops marked since late April, close to 1.3655–70.

On the flip side, USD/CAD sellers will seek a daily closing beneath the 200-DMA level of 1.3450 to rethink returning from the camp.

Even so, a four-month-long rising trend line near 1.3400 will test the Loonie pair’s downside before giving control to the bears.

USD/CAD: Daily chart
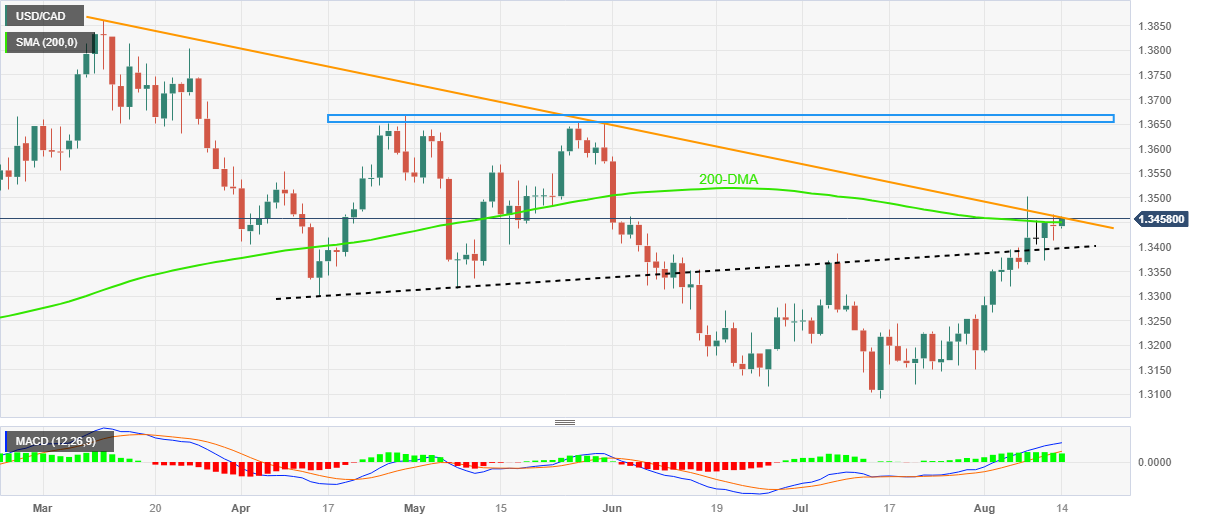
Trend: Further upside expected

Additional important levels

Overview
Today last price1.3458
Today Daily Change0.0016
Today Daily Change %0.12%
Today daily open1.3442
 
Trends
Daily SMA201.328
Daily SMA501.3268
Daily SMA1001.3388
Daily SMA2001.345
 
Levels
Previous Daily High1.3466
Previous Daily Low1.3412
Previous Weekly High1.3502
Previous Weekly Low1.3356
Previous Monthly High1.3387
Previous Monthly Low1.3093
Daily Fibonacci 38.2%1.3433
Daily Fibonacci 61.8%1.3446
Daily Pivot Point S11.3415
Daily Pivot Point S21.3387
Daily Pivot Point S31.3361
Daily Pivot Point R11.3468
Daily Pivot Point R21.3494
Daily Pivot Point R31.3522

Author

Anil Panchal

Anil Panchal

FXStreet

Anil Panchal has nearly 15 years of experience in tracking financial markets. With a keen interest in macroeconomics, Anil aptly tracks global news/updates and stays well-informed about the global financial moves and their implications.


More from Anil Panchal
Share:

Editor's Picks

GBP/USD looks for direction around 1.3500

GBP/USD alternates gains with losses around the 1.3500 neighbourhood on Tuesday. That said, Cable struggles to extend its recent marked recovery in a context of continuous instability in the Middle East, which in turn keeps the Greenback well supported.

EUR/USD treads water around 1.1540

EUR/USD struggles to gather momentum on Tuesday, trading in an inconclusive fashion around 1.1540. Indeed, the pair’s price action comes amid the absence of clear direction in the US Dollar, as traders continue to closely follow developments in the Middle East.

Gold eases from tops, challenges $4,400

Gold retreats from its earlier tops and slips back below the key $4,400 mark per troy ounce on Tuesday. The precious metal’s marginal gains comes on the back of a sidelined price action in the US Dollar amid steady uncertainty from the geopolitical landscape.

Crypto Today: Bitcoin and Ethereum consolidate, XRP dips as optimism for a US-Iran deal fades

Bitcoin (BTC) maintains a neutral outlook on Tuesday while testing support at $64,000. Investors appear to be sitting on the fence, awaiting a catalyst for a breakout above $65,000.

The inflation narrative is still way more important than the employment story
Core bonds sold off yesterday with the belly of the curve slightly underperforming in the US while European curves showed more of a bear flattening. Daily changes on the US curve varied between +4.7 bps (2-yr) and +6.4 bps (7-yr).
9-3: Is the Federal Reserve’s vote tally Warsh's new forward guidance?
The rate did not move. Neither did the statement, and that’s the more interesting fact. Set the July 29 Federal Open Market Committee (FOMC) statement beside the one issued on June 17, and the two documents are identical apart from a single verb and a paragraph at the bottom naming three dissenters.














