USD/CAD Price Analysis: Mildly offered at fortnight low near 1.2850, further downside expected


  • USD/CAD drops for the third consecutive day, extends pullback from six-week-old horizontal resistance.
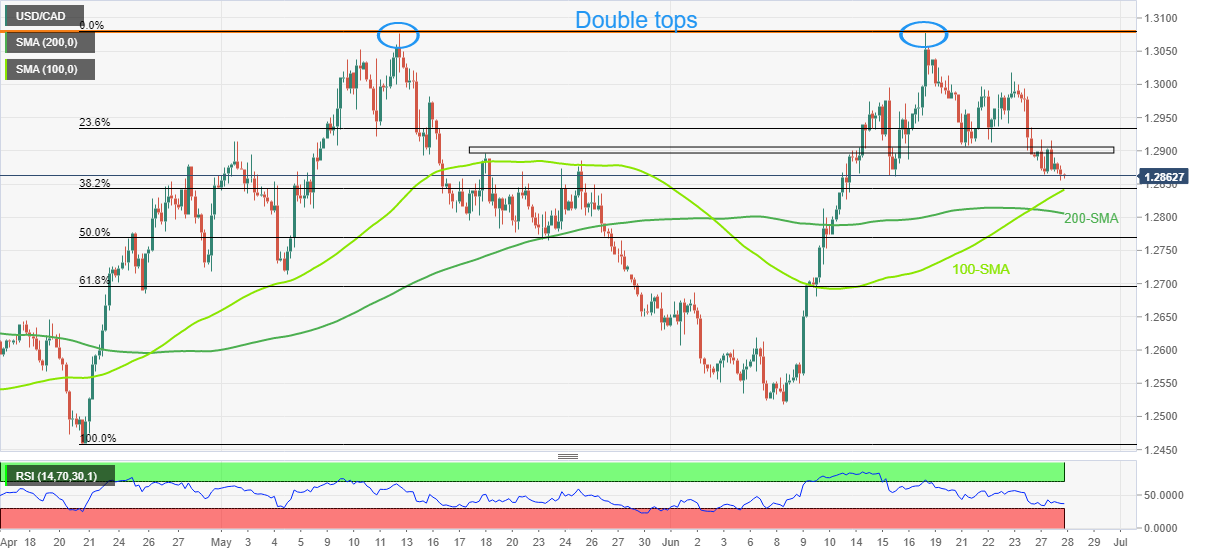
  • Downbeat RSI favors bears targeting 200-SMA, double tops challenge the advances.

USD/CAD prints a three-day downtrend as sellers flirt with the lowest levels in two weeks around 1.2860 during early Thursday morning in Europe.

The Loonie pair’s latest losses could be linked to the early week failure to cross a six-week-old horizontal resistance, as well as downbeat RSI (14).

With this, the USD/CAD sellers aim for the 100-SMA level surrounding 1.2840. However, the nearly oversold RSI conditions and the 200-SMA level, around 1.2805 by the press time, could restrict the quote’s further weakness.

In a case where the pair drops below 1.2805, the 50% and 61.8% Fibonacci retracement of April-June upside, respectively around 1.2770 and 1.2700, will be on the bear’s radar.

Meanwhile, USD/CAD bulls need a clear upside break of the 1.2900 mark, comprising the aforementioned horizontal area, to retake control.

Even so, the 1.3000 psychological magnet and the double tops marked around 1.3080 will be tough nuts to crack for the pair buyers.

Should the quote remains firmer past 1.3080, the odds of witnessing a rally towards the late 2020 peaks above 1.3400 can’t be ruled out.

USD/CAD: Four-hour chart

Trend: Further downside expected

Additional important levels

Overview
Today last price 1.2862
Today Daily Change -0.0017
Today Daily Change % -0.13%
Today daily open 1.2879
 
Trends
Daily SMA20 1.2798
Daily SMA50 1.2807
Daily SMA100 1.2732
Daily SMA200 1.2678
 
Levels
Previous Daily High 1.2916
Previous Daily Low 1.2865
Previous Weekly High 1.3039
Previous Weekly Low 1.289
Previous Monthly High 1.3077
Previous Monthly Low 1.2629
Daily Fibonacci 38.2% 1.2884
Daily Fibonacci 61.8% 1.2897
Daily Pivot Point S1 1.2857
Daily Pivot Point S2 1.2835
Daily Pivot Point S3 1.2805
Daily Pivot Point R1 1.2909
Daily Pivot Point R2 1.2939
Daily Pivot Point R3 1.2961


Share: Feed news

Information on these pages contains forward-looking statements that involve risks and uncertainties. Markets and instruments profiled on this page are for informational purposes only and should not in any way come across as a recommendation to buy or sell in these assets. You should do your own thorough research before making any investment decisions. FXStreet does not in any way guarantee that this information is free from mistakes, errors, or material misstatements. It also does not guarantee that this information is of a timely nature. Investing in Open Markets involves a great deal of risk, including the loss of all or a portion of your investment, as well as emotional distress. All risks, losses and costs associated with investing, including total loss of principal, are your responsibility. The views and opinions expressed in this article are those of the authors and do not necessarily reflect the official policy or position of FXStreet nor its advertisers. The author will not be held responsible for information that is found at the end of links posted on this page.

If not otherwise explicitly mentioned in the body of the article, at the time of writing, the author has no position in any stock mentioned in this article and no business relationship with any company mentioned. The author has not received compensation for writing this article, other than from FXStreet.

FXStreet and the author do not provide personalized recommendations. The author makes no representations as to the accuracy, completeness, or suitability of this information. FXStreet and the author will not be liable for any errors, omissions or any losses, injuries or damages arising from this information and its display or use. Errors and omissions excepted.

The author and FXStreet are not registered investment advisors and nothing in this article is intended to be investment advice.

Recommended content


Recommended content

Editors’ Picks

AUD/USD could extend the recovery to 0.6500 and above

AUD/USD could extend the recovery to 0.6500 and above

The enhanced risk appetite and the weakening of the Greenback enabled AUD/USD to build on the promising start to the week and trade closer to the key barrier at 0.6500 the figure ahead of key inflation figures in Australia.

AUD/USD News

EUR/USD now refocuses on the 200-day SMA

EUR/USD now refocuses on the 200-day SMA

EUR/USD extended its positive momentum and rose above the 1.0700 yardstick, driven by the intense PMI-led retracement in the US Dollar as well as a prevailing risk-friendly environment in the FX universe.

EUR/USD News

Gold struggles around $2,325 despite broad US Dollar’s weakness

Gold struggles around $2,325 despite broad US Dollar’s weakness

Gold reversed its direction and rose to the $2,320 area, erasing a large portion of its daily losses in the process. The benchmark 10-year US Treasury bond yield stays in the red below 4.6% following the weak US PMI data and supports XAU/USD.

Gold News

Bitcoin price makes run for previous cycle highs as Morgan Stanley pushes BTC ETF exposure

Bitcoin price makes run for previous cycle highs as Morgan Stanley pushes BTC ETF exposure

Bitcoin (BTC) price strength continues to grow, three days after the fourth halving. Optimism continues to abound in the market as Bitcoiners envision a reclamation of previous cycle highs.

Read more

US versus the Eurozone: Inflation divergence causes monetary desynchronization

US versus the Eurozone: Inflation divergence causes monetary desynchronization

Historically there is a very close correlation between changes in US Treasury yields and German Bund yields. This is relevant at the current juncture, considering that the recent hawkish twist in the tone of the Federal Reserve might continue to push US long-term interest rates higher and put upward pressure on bond yields in the Eurozone. 

Read more

Forex MAJORS

Cryptocurrencies

Signatures