USD/CAD Price Analysis: Justifies rising wedge confirmation around 1.2650
- USD/CAD prints three-day downtrend as sellers attack weekly low.
- Confirmation of the bearish chart pattern joins descending RSI line to favor sellers.
- 50-SMA acts as immediate support ahead of early monthly swing high.
- Descending trend line from Tuesday adds to the upside filters.

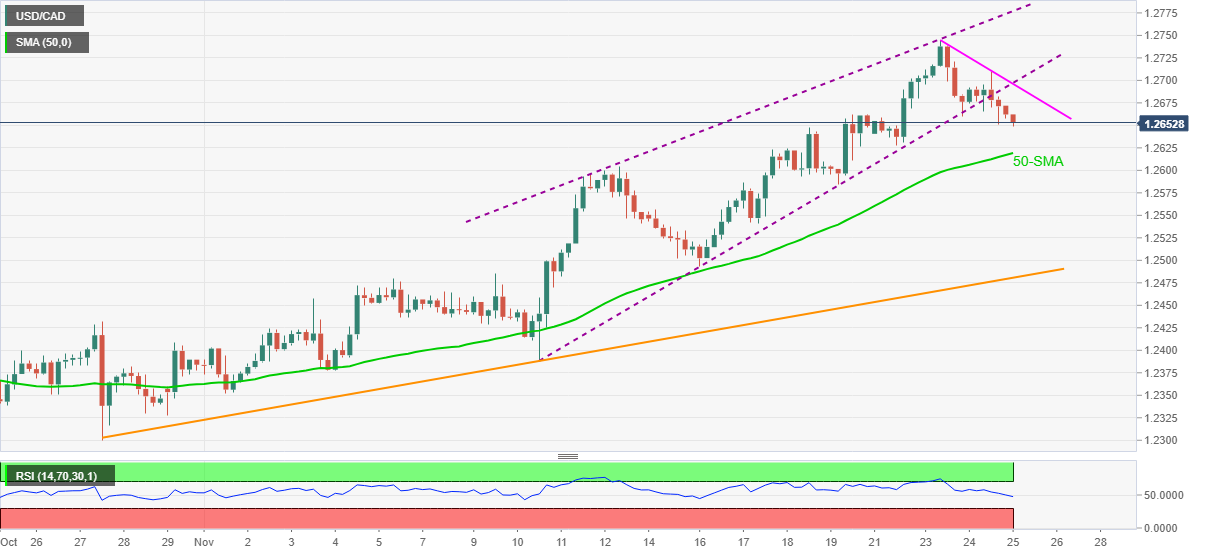
USD/CAD remains on the back foot for the third consecutive day, taking offers around 1.2650 to refresh intraday low during early Thursday.
The Loonie pair confirmed a rising wedge bearish chart pattern the previous day and the downward sloping RSI, not oversold, added strength to the fall afterward.
That said, the quote currently drops towards 50-SMA around 1.2620 but the early November highs near 1.2600 will challenge the USD/CAD bears afterward.
It should be noted that the theoretical target hints at a fresh monthly low under 1.2350 wherein the one-month-old rising support line can add to the downside filters near 1.2480.
Meanwhile, corrective pullback needs to cross the immediate resistance line from Tuesday, close to 1.2700, before recalling the USD/CAD bulls.
Following that, the monthly peak of 1.2744 and late September’s high near 1.2775 will be in focus.
USD/CAD: Four-hour chart
Trend: Further weakness expected
Author

Anil Panchal
FXStreet
Anil Panchal has nearly 15 years of experience in tracking financial markets. With a keen interest in macroeconomics, Anil aptly tracks global news/updates and stays well-informed about the global financial moves and their implications.


