|

USD/CAD Price Analysis: Hovers around 1.3750; grapples to return to rising channel

  • USD/CAD could test the lower boundary of the rising channel, potentially rebounding to re-enter the rising channel.
  • Further movements on the 14-day RSI will provide a clearer directional indication.
  • The pair could find key support at the psychological level of 1.3700 and the 50-day EMA of 1.3670 level.

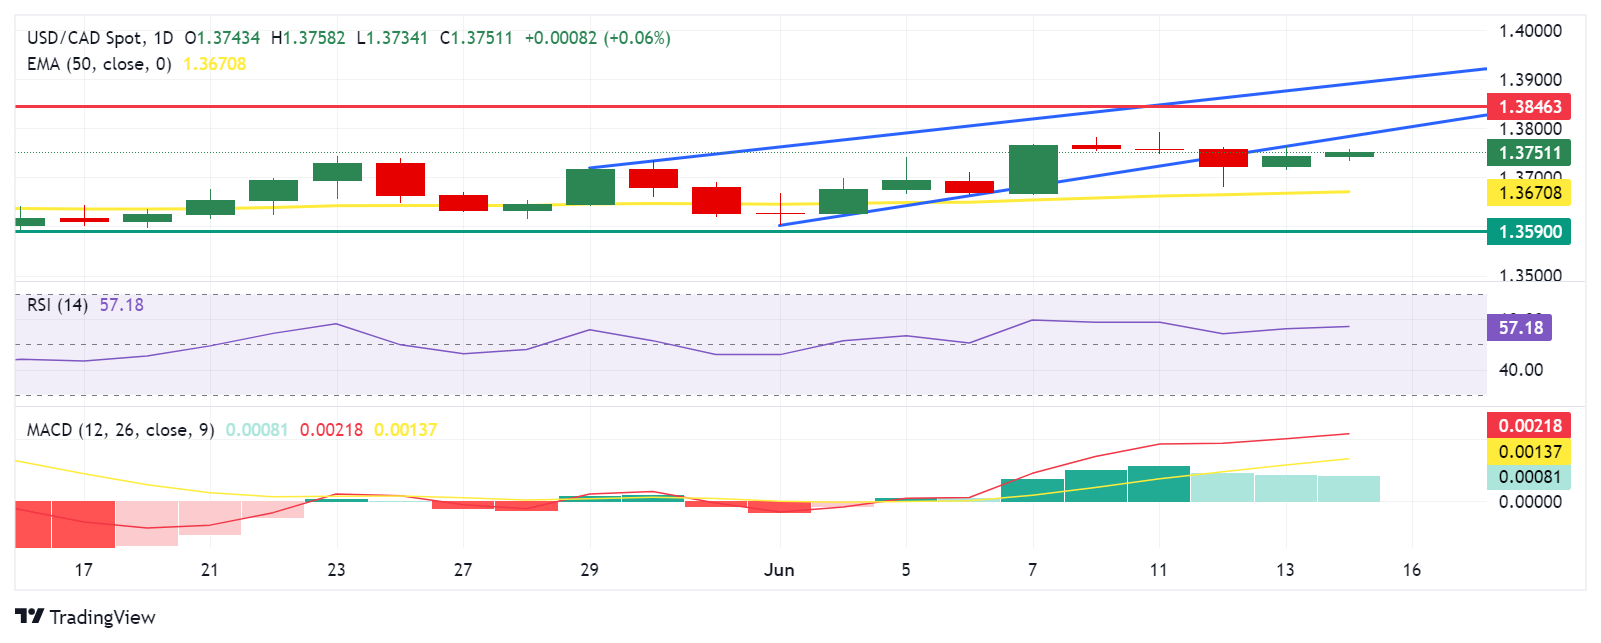
USD/CAD extends its gains for the second day, trading around 1.3750 during early European hours on Friday. Analysis of the daily chart indicates a weakening bullish bias for the USD/CAD pair, as it struggles to re-enter the rising channel pattern. Despite this, the 14-day Relative Strength Index (RSI) remains above the 50 level, suggesting that the bullish momentum is not entirely lost. Further price movements will be needed to provide a clearer directional indication.

Additionally, the momentum indicator Moving Average Convergence Divergence (MACD) suggests an upward trend for the USD/CAD pair, as the MACD line is positioned above the centerline and shows divergence above the signal line. This indicates that the bullish momentum may continue and support the pair to return to the rising channel pattern.

The USD/CAD pair may test the lower boundary of the rising channel around 1.3780, followed by the key barrier at the psychological level of 1.3800. Further support is found at April’s high of 1.3846. A break above this level could lead the USD/CAD pair to approach the upper threshold of the rising channel around 1.3890.

On the downside, the USD/CAD pair could find immediate support at the psychological level of 1.3700, which aligns with the 50-day Exponential Moving Average (EMA) at 1.3670. A break below this level could exert pressure on the pair, pushing it toward the throwback support region around 1.3590.

USD/CAD: Daily Chart

USD/CAD

Overview
Today last price1.3753
Today Daily Change0.0010
Today Daily Change %0.07
Today daily open1.3743
 
Trends
Daily SMA201.3685
Daily SMA501.3689
Daily SMA1001.3601
Daily SMA2001.358
 
Levels
Previous Daily High1.3764
Previous Daily Low1.3715
Previous Weekly High1.3768
Previous Weekly Low1.3603
Previous Monthly High1.3783
Previous Monthly Low1.359
Daily Fibonacci 38.2%1.3745
Daily Fibonacci 61.8%1.3734
Daily Pivot Point S11.3717
Daily Pivot Point S21.3692
Daily Pivot Point S31.3669
Daily Pivot Point R11.3766
Daily Pivot Point R21.3789
Daily Pivot Point R31.3815

Author

Akhtar Faruqui

Akhtar Faruqui is a Forex Analyst based in New Delhi, India. With a keen eye for market trends and a passion for dissecting complex financial dynamics, he is dedicated to delivering accurate and insightful Forex news and analysis.

More from Akhtar Faruqui
Share:

Markets move fast. We move first.

Orange Juice Newsletter brings you expert driven insights - not headlines. Every day on your inbox.

By subscribing you agree to our Terms and conditions.

Editor's Picks

EUR/USD clings to small gains near 1.1750

Following a short-lasting correction in the early European session, EUR/USD regains its traction and clings to moderate gains at around 1.1750 on Monday. Nevertheless, the pair's volatility remains low, with investors awaiting this weeks key US data releases and the ECB policy announcements.

GBP/USD edges higher toward 1.3400 as traders await key data and BoE

GBP/USD reverses its direction and advances toward 1.3400 following a drop to the 1.3350 area earlier in the day. The US Dollar struggles to gather recovery momentum as markets await Tuesday's Nonfarm Payrolls data, while the Pound Sterling holds steady ahead of the BoE policy announcements later in the week.

Gold builds on previous week's gains, approaches $4,350

Gold preserves its bullish momentum after rising more than 2% last week and climbs toward $4,350 on Monday. The precious metal extends its upside as the US Dollar remains on the back foot on growing expectations for a dovish Fed policy outlook next year.

Solana consolidates as spot ETF inflows near $1 billion signal institutional dip-buying

Solana price hovers above $131 at the time of writing on Monday, nearing the upper boundary of a falling wedge pattern, awaiting a decisive breakout. On the institutional side, demand for spot Solana Exchange-Traded Funds remained firm, pushing total assets under management to nearly $1 billion since launch. 

Big week ends with big doubts

The S&P 500 continued to push higher yesterday as the US 2-year yield wavered around the 3.50% mark following a Federal Reserve (Fed) rate cut earlier this week that was ultimately perceived as not that hawkish after all. The cut is especially boosting the non-tech pockets of the market.

Solana Price Forecast: SOL consolidates as spot ETF inflows near $1 billion signal institutional dip-buying

Solana (SOL) price hovers above $131 at the time of writing on Monday, nearing the upper boundary of a falling wedge pattern, awaiting a decisive breakout.