|

USD/CAD Price Analysis: Hovers above 1.3650 major level on surging US Dollar

  • USD/CAD moves above 1.3650 due to the upbeat US Dollar.
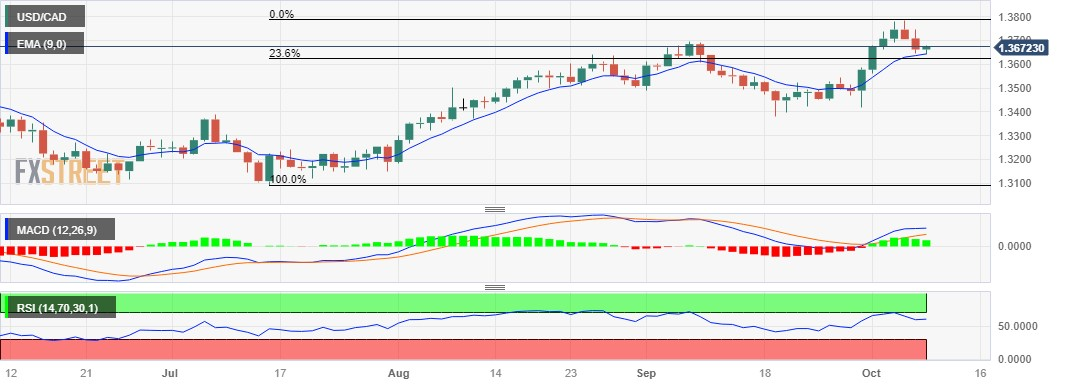
  • Technical indicators suggest a bullish momentum in the price movement.
  • The nine-day EMA emerges as immediate support, followed by the 23.6% Fibonacci retracement.

USD/CAD snaps the two-day losing streak, trading higher around 1.3670 aligned with the 1.3700 psychological level during the early European session on Monday. The pair is receiving upward support due to a recovery in the US Dollar (USD).

A firm break above the latter could open the doors for the USD/CAD pair to explore an area near the major level at 1.3750 lined up with the previous week’s high at 1.3785, following the 1.3800 psychological level.

However, the USD/CAD pair faced downward pressure due to surging oil prices, which could be attributed to the Palestine-Israel military conflict.

The deteriorating geopolitical tensions could impact the Canadian Dollar (CAD), especially since Canada is the largest oil exporter to the United States (US).

On the downside, the psychological level at 1.3650 could act as an immediate barrier lined up with the nine-day Exponential Moving Average (EMA) at 1.3643, followed by the 23.6% Fibonacci retracement at 1.3622 level.

The Moving Average Convergence Divergence (MACD) indicator is indicating stronger momentum in the price movement as it lies above the centerline and the signal line. This configuration suggests an upward trend in the market.

However, the prevailing upward momentum in the USD/CAD pair indicates a bullish bias, as the 14-day Relative Strength Index (RSI) remains above the 50 level.

USD/CAD: Daily Chart

USD/CAD: important levels to watch

Overview
Today last price1.3671
Today Daily Change0.0009
Today Daily Change %0.07
Today daily open1.3662
 
Trends
Daily SMA201.3555
Daily SMA501.3522
Daily SMA1001.3414
Daily SMA2001.3462
 
Levels
Previous Daily High1.3746
Previous Daily Low1.3644
Previous Weekly High1.3786
Previous Weekly Low1.3562
Previous Monthly High1.3694
Previous Monthly Low1.3379
Daily Fibonacci 38.2%1.3683
Daily Fibonacci 61.8%1.3707
Daily Pivot Point S11.3622
Daily Pivot Point S21.3582
Daily Pivot Point S31.3519
Daily Pivot Point R11.3724
Daily Pivot Point R21.3786
Daily Pivot Point R31.3826

Author

Akhtar Faruqui

Akhtar Faruqui is a Forex Analyst based in New Delhi, India. With a keen eye for market trends and a passion for dissecting complex financial dynamics, he is dedicated to delivering accurate and insightful Forex news and analysis.

More from Akhtar Faruqui
Share:

Editor's Picks

AUD/USD eyes 0.7150 barrier nine-day EMA

AUD/USD inches higher after registering modest losses in the previous day, trading around 0.7130 during the Asian hours. The technical analysis of the daily chart indicates that the pair is moving sideways within the rectangle pattern, suggesting a consolidation as neither the bulls nor the bears have enough momentum to take control of the market.

USD/JPY trades below 160.00 intervention threshold; bullish bias intact

The USD/JPY pair attracts some sellers during the Asian session amid fears that authorities will step in again to prop up the Japanese Yen. Furthermore, the Israel-Lebanon truce prompts some profit-taking around the US Dollar and exerts downward pressure on the currency pair.

Gold defends 200-day SMA at $4,425, but for how long?

Gold is attempting a tepid recovery toward $4,500 early Thursday, as renewed optimism in the Mideast geopolitical front calms market nerves. This cautious optimism across Asian markets weighs on Oil prices, and diminishes the US Dollar’s safe-haven appeal, helping Gold stage a decent comeback from the weekly low of $4,424.


Hyperliquid: ETF demand, capital rotation fuel HYPE rally as Bitcoin melts

Hyperliquid price sustains an upward trend near its all-time high of $75.76 on Thursday after posting 80% gains in May, while Bitcoin (BTC) retraces below $65,000, triggering a market-wide panic.

Kevin Warsh takes the Fed helm: What it means for the US Dollar
The Federal Reserve moves away from the highly predictable "forward guidance" model of the Jerome Powell era to a new “Kevin Warsh environment”, characterized by less communication, more policy surprises, and an increased focus on the Fed's complex balance sheet.
Recession on paper: What really moves the Canadian Loonie now?

Statistics Canada handed the headline writers a gift and the analysts a headache. Real GDP shrank 0.1% on an annualized basis in the first quarter, and with the fourth quarter of 2025 revised down to a 1.0% contraction, that is two negative quarters in a row, the textbook definition of a technical recession and Canada's first since the pandemic.