USD/CAD Price Analysis: Flirts with 200-SMA after confirming rising wedge bearish pattern
- USD/CAD consolidates recent losses despite confirming bearish chart formation.
- Ascending support line from late June becomes the key, three-week-old horizontal area challenges buyers.
- Downbeat Momentum line, rising wedge confirmation keep sellers hopeful.

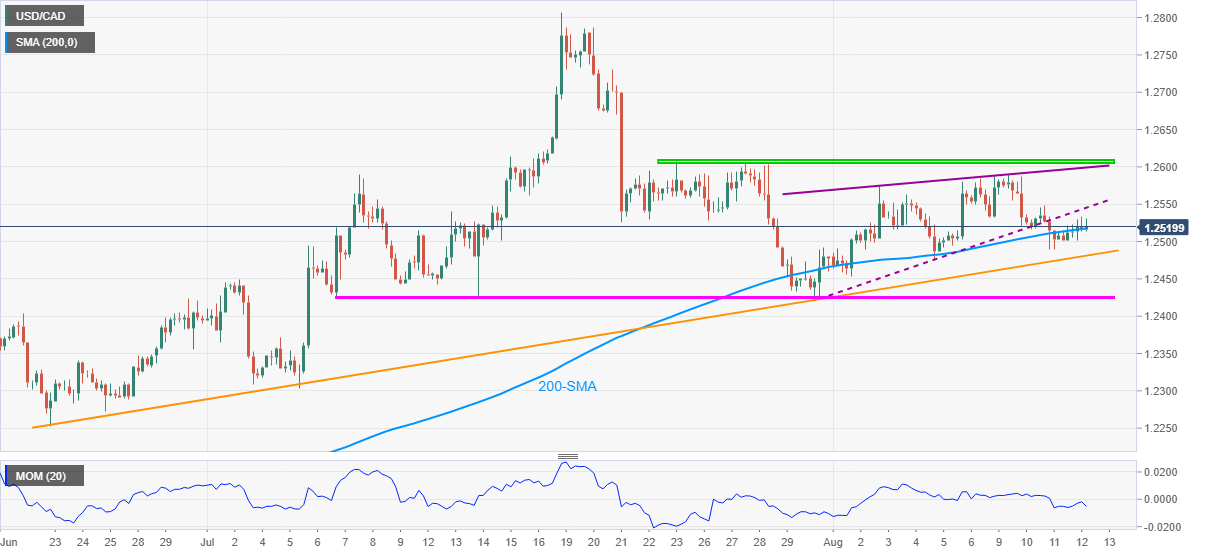
USD/CAD refreshes intraday low to 1.2519, down 0.05% on a day, amid Friday’s Asian session. Even so, the Loonie pair seesaws around 200-SMA while raising doubts on the rising wedge confirmation, portrayed on Thursday.
In addition to lacking a clear downside below the 200-SMA level of 1.2515, an ascending support line from June 23, close to 1.2480, also challenges the pair sellers.
It should be noted that sustained trading below 1.2480 will not hesitate to challenge five-week-long horizontal support surrounding 1.2420.
Meanwhile, USD/CAD sellers remain hopeful unless the quote bounces back beyond 1.2545, defying the bearish pattern.
Even so, the formation’s upper line and a short-term horizontal resistance, respectively near 1.2600 and 1.2610, will be a strong hurdle for the bulls to retake controls.
Should the quote remains firmer past 1.2610, 1.2670 and 1.2730 will be important to watch ahead of the previous month’s top around 1.2810.
USD/CAD: Four-hour chart
Trend: Further weakness expected
Author

Anil Panchal
FXStreet
Anil Panchal has nearly 15 years of experience in tracking financial markets. With a keen interest in macroeconomics, Anil aptly tracks global news/updates and stays well-informed about the global financial moves and their implications.


