USD/CAD Price Analysis: Falls but faces solid support around the 20-DMA
- USD/CAD drops from weekly highs above 1.3700 on sentiment improvement.
- The USD/CAD fall was capped by sellers unable to crack the 20-day EMA.
- USD/CAD Price Analysis: For a bearish resumption, the USD/CAD needs a daily close below 1.3661.

USD/CAD is erasing last Friday’s gains, hovering at around the 20-day Exponential Moving Average (EMA) at 1.3661 after hitting a daily high of 1.3746. A risk-on impulse on news that UBS bought Credit Suisse calmed tensions amidst turbulence in the banking system. Therefore, the USD/CAD exchanges hands at 1.3676, down 0.41%.
USD/CAD Price action
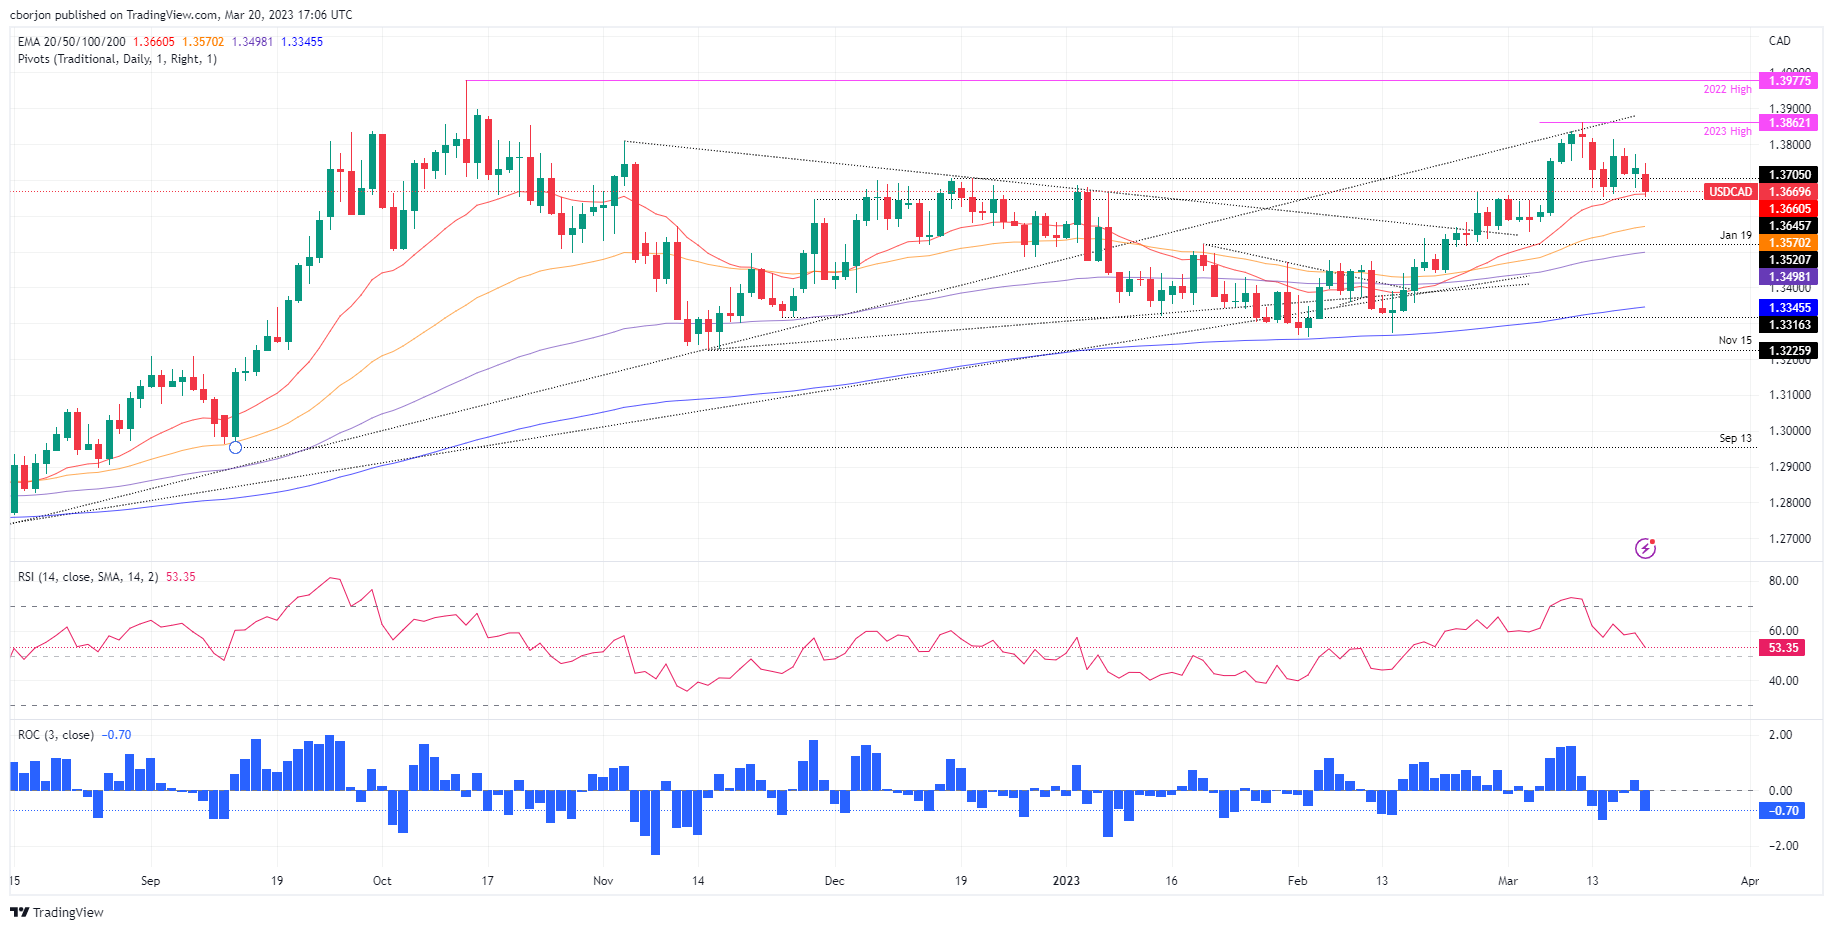
After peaking at 1.3862 ten days ago, the USD/CAD resumed its downtrend amidst overall US Dollar (USD) weakness. However, it should be said that the 20-day EMA has acted as a solid support, so for a bearish resumption, the USD/CAD must register a daily close below 1.3661.
Oscillators portray sellers gathering momentum, though the Relative Strength Index (RSI) needs to punch below the 50-midline, to further confirm a bearish continuation. Contrarily, the Rate of Change (RoC) indicates selling pressure increased. Therefore, the USD/CAD might test lower prices in the near term.
The USD/CAD first support would be the 20-day EMA at 1.3661, followed by the March 14 low at 1.3651. Break below, and the USD/CAD could tumble to 1.3600 before testing the 50-day EMA at 1.3570. Once cleared, the 100-day EMA at around 1.3500 would be challenged.
On the flip side, the USD/CAD first resistance would be the 1.3700 figure. A breach of the latter will expose the daily high at 1.3746, followed by 1.3800 and the last week’s high at 1.3814.
USD/CAD Daily chart
USD/CAD Technical levels
Author

Christian Borjon Valencia
FXStreet
Markets analyst, news editor, and trading instructor with over 14 years of experience across FX, commodities, US equity indices, and global macro markets.


