USD/CAD Price Analysis: Downside appears limited amid a bull cross


  • USD/CAD consolidates Monday’s pullback from a two-month top.
  • The corrective decline appears limited after a bull cross confirmed on the 1D chart.
  • Daily RSI edges lower but remains well above the midline.

USD/CAD is posting small losses while trading below 1.2750, as the sellers take a breather after a solid rebound in the US dollar and WTI prices seen on Monday.

The latest drop in the major could be attributed to the renewed weakness in the US dollar across the board, as the markets remain optimistic about the less severe effects of the Omicron covid variant.

Investors look forward to Fed Chair Jerome Powell’s testimony on the CARES Act later on Tuesday, especially after his prepared remarks underscored risks to the economy from the new covid strain.

Also, in focus remains the Canadian GDP data for fresh trading impetus amid ongoing OPEC+ headlines.

Looking at USD/CAD’s daily chart, the bulls are fighting to regain lost ground, looking to take advantage of the bull cross confirmed earlier this Tuesday.

The 14-day Relative Strength Index (RSI) is slightly lower but holds comfortably above the midline, suggesting that buying resurgence could be in the offing.

Bulls will need to cross the daily highs of 1.2766 to seek additional recovery towards the 1.2800 level.

USD/CAD: Daily chart

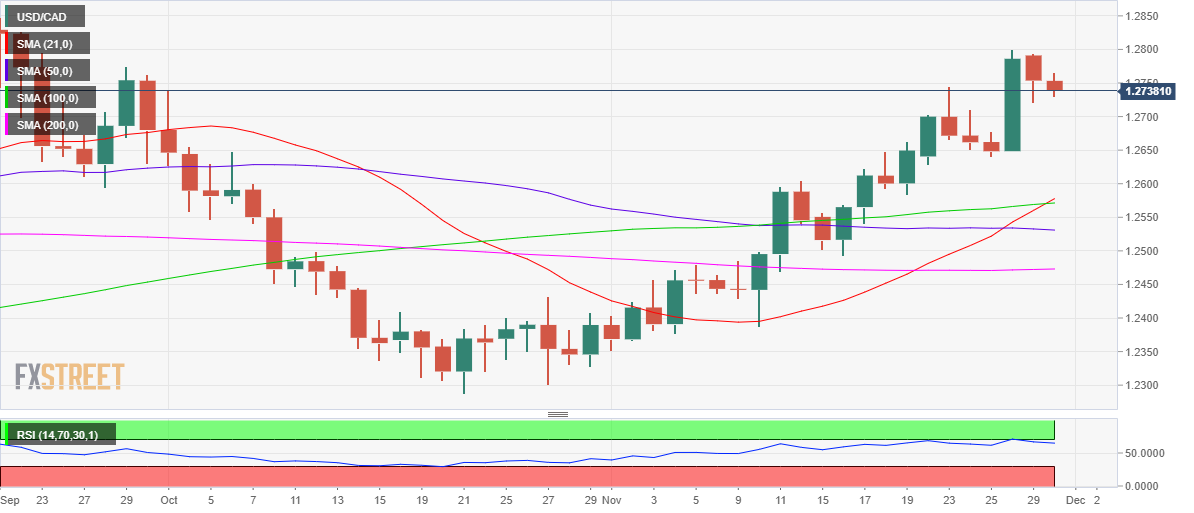
On the downside, Monday’s low of 1.2721 will offer immediate support to the bullish traders, below which a drop towards the 1.2650 psychological level cannot be ruled out, where Friday’s low coincides.

Further south, bears will challenge the bullish commitments at the 1.2600 mark.

USD/CAD: Additional levels

USD/CAD

Overview
Today last price 1.2737
Today Daily Change -0.0017
Today Daily Change % -0.13
Today daily open 1.2754
 
Trends
Daily SMA20 1.257
Daily SMA50 1.2533
Daily SMA100 1.2569
Daily SMA200 1.2472
 
Levels
Previous Daily High 1.2793
Previous Daily Low 1.2721
Previous Weekly High 1.28
Previous Weekly Low 1.2628
Previous Monthly High 1.2739
Previous Monthly Low 1.2288
Daily Fibonacci 38.2% 1.2749
Daily Fibonacci 61.8% 1.2766
Daily Pivot Point S1 1.2719
Daily Pivot Point S2 1.2684
Daily Pivot Point S3 1.2646
Daily Pivot Point R1 1.2791
Daily Pivot Point R2 1.2828
Daily Pivot Point R3 1.2863


Share: Feed news

Information on these pages contains forward-looking statements that involve risks and uncertainties. Markets and instruments profiled on this page are for informational purposes only and should not in any way come across as a recommendation to buy or sell in these assets. You should do your own thorough research before making any investment decisions. FXStreet does not in any way guarantee that this information is free from mistakes, errors, or material misstatements. It also does not guarantee that this information is of a timely nature. Investing in Open Markets involves a great deal of risk, including the loss of all or a portion of your investment, as well as emotional distress. All risks, losses and costs associated with investing, including total loss of principal, are your responsibility. The views and opinions expressed in this article are those of the authors and do not necessarily reflect the official policy or position of FXStreet nor its advertisers. The author will not be held responsible for information that is found at the end of links posted on this page.

If not otherwise explicitly mentioned in the body of the article, at the time of writing, the author has no position in any stock mentioned in this article and no business relationship with any company mentioned. The author has not received compensation for writing this article, other than from FXStreet.

FXStreet and the author do not provide personalized recommendations. The author makes no representations as to the accuracy, completeness, or suitability of this information. FXStreet and the author will not be liable for any errors, omissions or any losses, injuries or damages arising from this information and its display or use. Errors and omissions excepted.

The author and FXStreet are not registered investment advisors and nothing in this article is intended to be investment advice.

Recommended content


Recommended content

Editors’ Picks

AUD/USD holds hot Australian CPI-led gains above 0.6500

AUD/USD holds hot Australian CPI-led gains above 0.6500

AUD/USD consolidates hot Australian CPI data-led strong gains above 0.6500 in early Europe on Wednesday. The Australian CPI rose 1% in QoQ in Q1 against the 0.8% forecast, providing extra legs to the Australian Dollar upside. 

AUD/USD News

USD/JPY sticks to 34-year high near 154.90 as intervention risks loom

USD/JPY sticks to 34-year high near 154.90 as intervention risks loom

USD/JPY is sitting at a multi-decade high of 154.88 reached on Tuesday. Traders refrain from placing fresh bets on the pair as Japan's FX intervention risks loom. Broad US Dollar weakness also caps the upside in the major. US Durable Goods data are next on tap. 

USD/JPY News

Gold price struggles to lure buyers amid positive risk tone, reduced Fed rate cut bets

Gold price struggles to lure buyers amid positive risk tone, reduced Fed rate cut bets

Gold price lacks follow-through buying and is influenced by a combination of diverging forces. Easing geopolitical tensions continue to undermine demand for the safe-haven precious metal. Tuesday’s dismal US PMIs weigh on the USD and lend support ahead of the key US macro data.

Gold News

Crypto community reacts as BRICS considers launching stablecoin for international trade settlement

Crypto community reacts as BRICS considers launching stablecoin for international trade settlement

BRICS is intensifying efforts to reduce its reliance on the US dollar after plans for its stablecoin effort surfaced online on Tuesday. Most people expect the stablecoin to be backed by gold, considering BRICS nations have been accumulating large holdings of the commodity.

Read more

US versus the Eurozone: Inflation divergence causes monetary desynchronization

US versus the Eurozone: Inflation divergence causes monetary desynchronization

Historically there is a very close correlation between changes in US Treasury yields and German Bund yields. This is relevant at the current juncture, considering that the recent hawkish twist in the tone of the Fed might continue to push US long-term interest rates higher and put upward pressure on bond yields in the Eurozone.

Read more

Forex MAJORS

Cryptocurrencies

Signatures