|

USD/CAD Price Analysis: Dollar on fire, shoots to 4-year highs, breaking 1.4000 figure vs. CAD

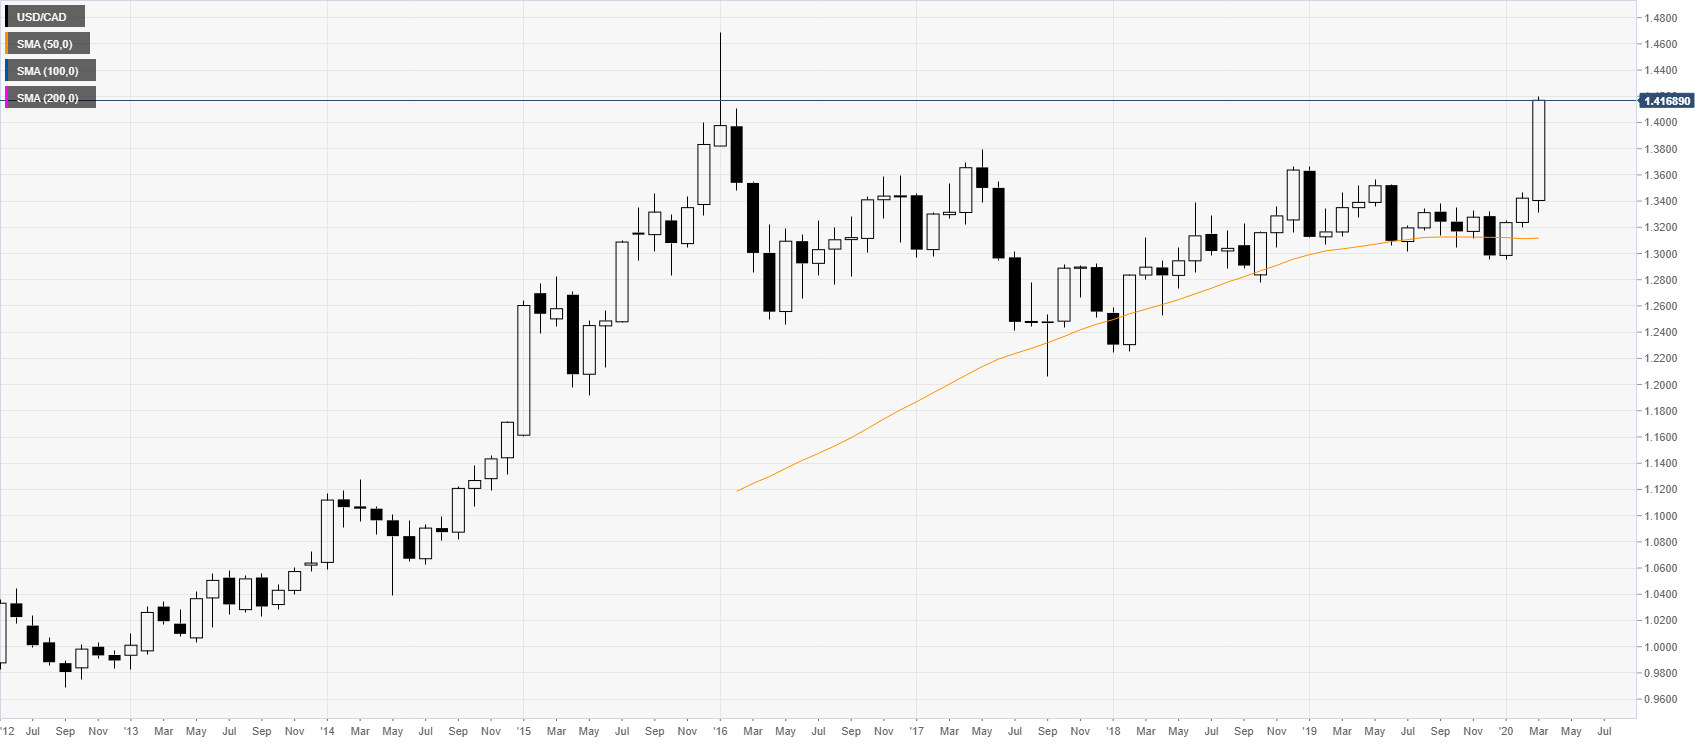
  • USD/CAD is trading near levels last seen in January 2016. 
  • USD/CAD is breaking above the 1.4000 figure.
 

USD/CAD monthly chart

 
USD/CAD is soaring to levels not seen since January 2016 as the quote broke above 1.4000 figure. The oil collapse is driving the Canadian dollar down and USD/CAD up. Additionally, broad-based USD strength is pushing the currency pair higher.
 

USD/CAD four-hour chart

 
USD/CAD is having the largest spike in five years as buyers broke above the 1.3972/1.4000 resistance zone. The break above the above-mentioned level can see USD/CAD run extend to the 1.4219, 1.4322 and 1.4500 levels according to the Technical Confluences Indicator. Support can be expected near 1.4115 and 1.4060 levels.
 
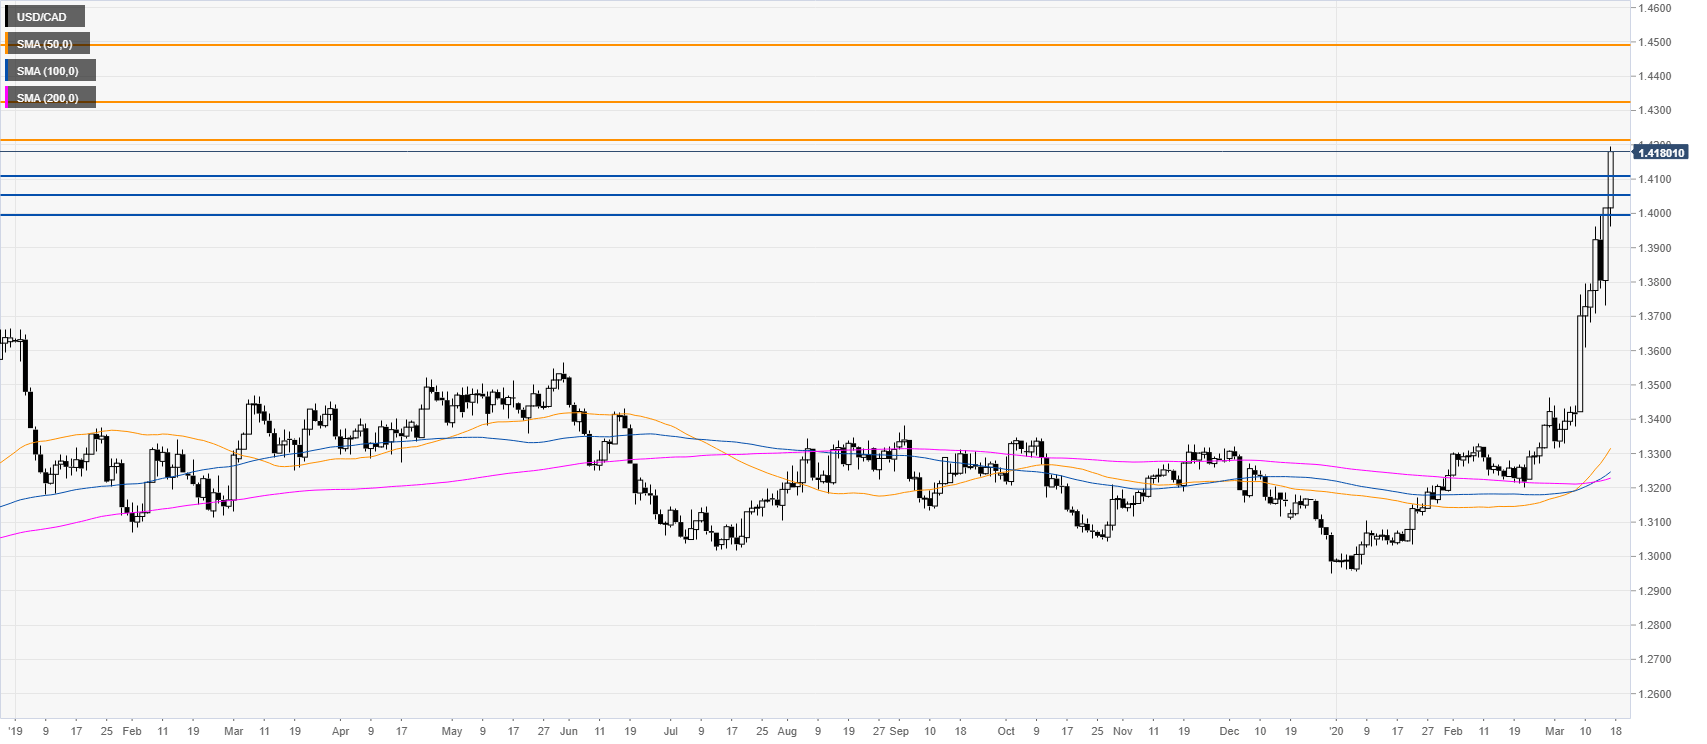
Resistance: 1.4219, 1.4322, 1.4500
Support: 1.4115, 1.4060, 1.4000 


Additional key levels

USD/CAD

Overview
Today last price1.4167
Today Daily Change0.0151
Today Daily Change %1.08
Today daily open1.4016
 
Trends
Daily SMA201.3478
Daily SMA501.3292
Daily SMA1001.3236
Daily SMA2001.3223
 
Levels
Previous Daily High1.4018
Previous Daily Low1.3732
Previous Weekly High1.3996
Previous Weekly Low1.3422
Previous Monthly High1.3465
Previous Monthly Low1.3202
Daily Fibonacci 38.2%1.3909
Daily Fibonacci 61.8%1.3841
Daily Pivot Point S11.3826
Daily Pivot Point S21.3635
Daily Pivot Point S31.3539
Daily Pivot Point R11.4112
Daily Pivot Point R21.4209
Daily Pivot Point R31.4399

Author

Flavio Tosti

Flavio Tosti

Independent Analyst


More from Flavio Tosti
Share:

Markets move fast. We move first.

Orange Juice Newsletter brings you expert driven insights - not headlines. Every day on your inbox.

By subscribing you agree to our Terms and conditions.

Editor's Picks

EUR/USD struggles to extend advance above 1.1800

The EUR/USD pair posts a fresh weekly low near 1.1740 during the Asian trading session on Wednesday. The major currency pair is under pressure as the US Dollar edges higher despite Federal Open Market Committee minutes of the December policy meeting, released on Tuesday, showing that most policymakers stressed the need for further interest rate cuts.

GBP/USD tests 1.3450 support after moving below nine-day EMA

GBP/USD remains subdued for the second consecutive day, trading around 1.3460 during the Asian hours on Wednesday. The technical analysis of the daily chart indicates a weakening of a bullish bias as the pair is positioned slightly below the lower boundary of the ascending channel pattern.

Gold jumps on US rate cut prospects, safe-haven demand

Gold price extends the rally above $4,350 during the early European trading hours on Wednesday. Gold's price has surged about 65% this year and is set to record its biggest annual gains since 1979. The rally in the precious metal is bolstered by the prospect of further US interest rate cuts in 2026. Lower interest rates could reduce the opportunity cost of holding Gold, supporting the non-yielding precious metal.

Bitcoin, Ethereum and XRP prepare for a potential New Year rebound

Bitcoin, Ethereum, and Ripple are holding steady on Wednesday after recording minor gains on the previous day. Technically, Bitcoin could extend gains within a triangle pattern while Ethereum and Ripple face critical overhead resistance. 

Economic outlook 2026-2027 in advanced countries: Solidity test

After a year marked by global economic resilience and ending on a note of optimism, 2026 looks promising and could be a year of solid economic performance. In our baseline scenario, we expect most of the supportive factors at work in 2025 to continue to play a role in 2026.

Crypto market outlook for 2026

Year 2025 was volatile, as crypto often is.  Among positive catalysts were favourable regulatory changes in the U.S., rise of Digital Asset Treasuries (DAT), adoption of AI and tokenization of Real-World-Assets (RWA).