|

USD/CAD Price Analysis: Descending channel hurdle might cap gains ahead of US GDP

  • USD/CAD gained some positive traction on Thursday and moved away from the post-BoC lows.
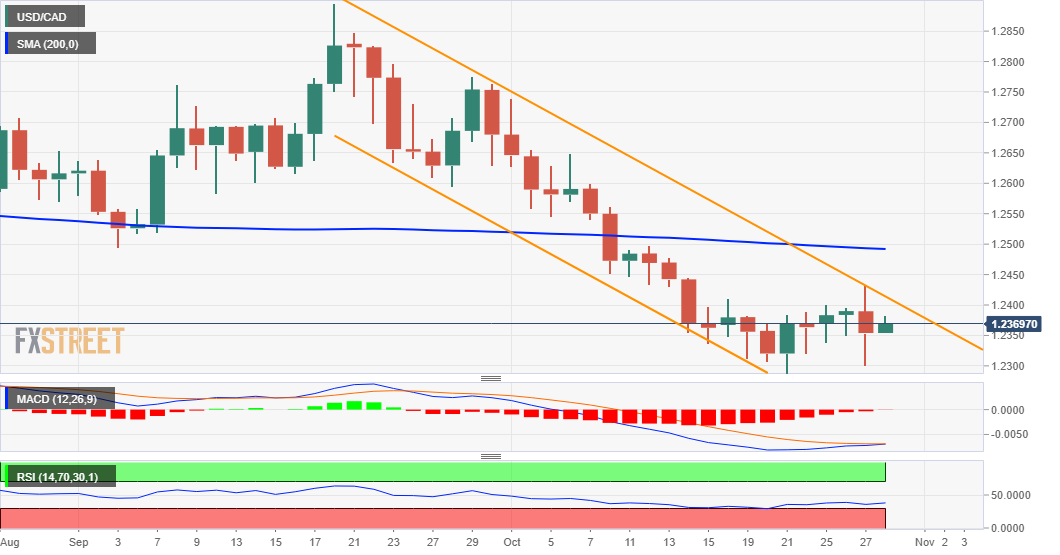
  • The descending channel formation warrants caution for bulls amid bearish technical indicators.

The USD/CAD pair built on the previous day's late rebound from the 1.2300 mark, or weekly lows and gained some positive traction on Thursday. The pair climbed to the 1.2380 region during the early part of the European session and has now reversed a major part of the post-BoC losses.

An extension of the corrective pullback in crude oil prices undermined the commodity-linked loonie and turned out to be a key factor that provided a modest lift to the USD/CAD pair. On the other hand, a goodish rebound in the US Treasury bond yields extended some support to the US dollar and remained supportive of the pair's intraday positive move.

Looking at the technical picture, the recent recovery from four-month lows faltered near the top end of a downward sloping channel in reaction to a more hawkish Bank of Canada on Wednesday. The mentioned barrier, currently around the 1.2410 region, should act as a pivotal point for traders as the focus remains glued to the Advance US Q3 GDP report.

Meanwhile, oscillators have been gaining positive traction lately and favour intraday bullish traders. That said, technical indicators on the daily chart – though have been recovering lately – are holding in the bearish territory. This makes it prudent to wait for a convincing break through the channel resistance before positioning for any further gains.

Above the mentioned barrier, the USD/CAD pair might then accelerate the momentum towards challenging the very important 200-day SMA, around the key 1.2500 psychological mark. Some follow-through buying will suggest that the recent leg down from September monthly swing lows has run its course and trigger a fresh bout of a short-covering move around the major.

On the flip side, the 1.2340 horizontal zone seems to protect the downside ahead of the 1.2300 round-figure mark. Failure to defend the said support levels will be seen as a fresh trigger for bearish traders and turn the USD/CAD pair vulnerable to break below the 1.2300 mark. The downward trajectory could get extended towards the ascending channel support, around the 1.2220 region.

USD/CAD daily chart

fxsoriginal

Technical levels to watch

USD/CAD

Overview
Today last price1.2372
Today Daily Change0.0018
Today Daily Change %0.15
Today daily open1.2354
 
Trends
Daily SMA201.2458
Daily SMA501.2586
Daily SMA1001.2523
Daily SMA2001.2493
 
Levels
Previous Daily High1.2432
Previous Daily Low1.23
Previous Weekly High1.241
Previous Weekly Low1.2288
Previous Monthly High1.2896
Previous Monthly Low1.2494
Daily Fibonacci 38.2%1.235
Daily Fibonacci 61.8%1.2382
Daily Pivot Point S11.2292
Daily Pivot Point S21.2231
Daily Pivot Point S31.2161
Daily Pivot Point R11.2424
Daily Pivot Point R21.2493
Daily Pivot Point R31.2555

Author

Haresh Menghani

Haresh Menghani is a detail-oriented professional with 10+ years of extensive experience in analysing the global financial markets.

More from Haresh Menghani
Share:

Markets move fast. We move first.

Orange Juice Newsletter brings you expert driven insights - not headlines. Every day on your inbox.

By subscribing you agree to our Terms and conditions.

Editor's Picks

EUR/USD declines toward 1.1700 on solid USD recovery

EUR/USD turns south and declines toward 1.1700 on Wednesday. A solid comeback staged by the US Dollar weighs heavily on the pair, as traders look to USD short covering ahead of US CPI on Thursday. However, the downside could be capped by hawkish ECB expectations. 

GBP/USD slides toward 1.3300 after softer-than-expected UK inflation data

GBP/USD has come under intense selling pressure, eyeing 1.3300 in the European session on Wednesday. The UK annual headline and core CPI rose by 3.2% each, missing estimates of 3.5% and 3.4%, respectively, reaffirming dovish BoE expectations and smashing the Pound Sterling across the board. 

Gold clings to modest gains above $4,300

Following Tuesday's volatile action, Gold regains its traction on Wednesday and trades in positive territory above $4,300. While the buildup in the USD recovery momentum caps XAU/USD's upside, the cautious market stance helps ithe pair hold its ground.

Bitcoin, Ethereum and Ripple extend correction as bearish momentum builds

Bitcoin, Ethereum, and Ripple remain under pressure as the broader market continues its corrective phase into midweek. The weak price action of these top three cryptocurrencies by market capitalization suggests a deeper correction, as momentum indicators are beginning to tilt bearish.

Ukraine-Russia in the spotlight once again

Since the start of the week, gold’s price has moved lower, but has yet to erase the gains made last week. In today’s report we intend to focus on the newest round of peace talks between Russia and Ukraine, whilst noting the release of the US Employment data later on day and end our report with an update in regards to the tensions brewing in Venezuela.

AAVE slips below $186 as bearish signals outweigh the SEC investigation closure

Aave (AAVE) price continues its decline, trading below $186 at the time of writing on Wednesday after a rejection at the key resistance zone. Derivatives positioning and momentum indicators suggest that bearish forces still dominate in the near term.