USD/CAD Price Analysis: Continues to remain sideways below 1.3450 ahead of US NFP
- USD/CAD is continuously trading sideways below 1.3450 following the footprints of the USD Index.
- Seventh straight contraction in US ISM Manufacturing PMI and dovish Fed commentary weigh heavily on the USD Index.
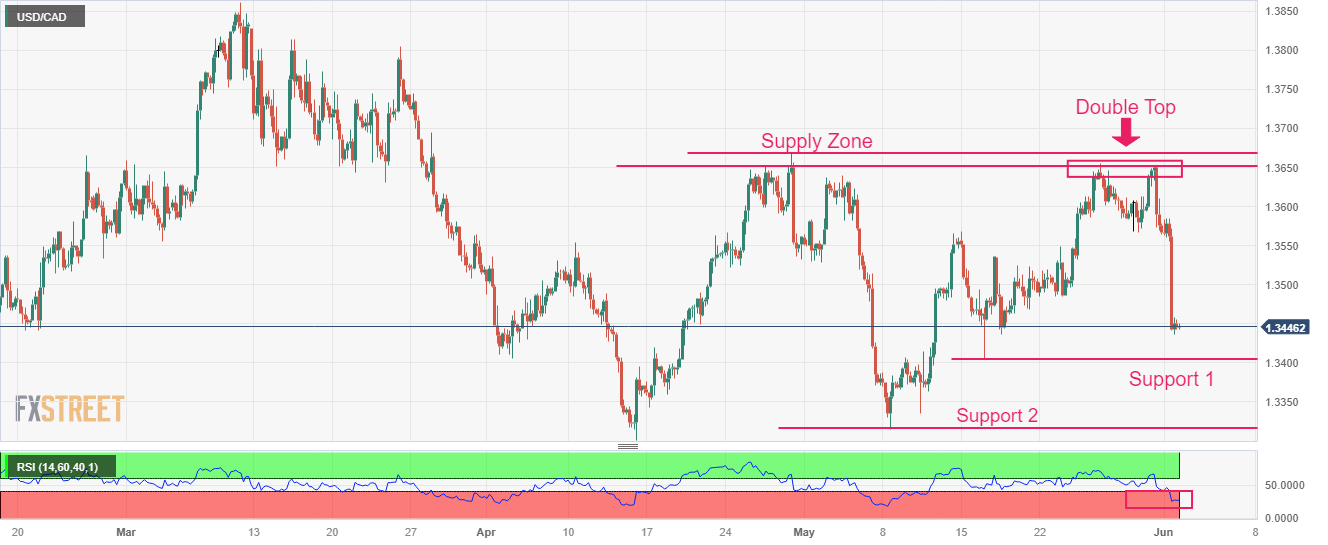
- USD/CAD witnessed a bloodbath after failing to surpass the supply zone plotted in a range of 1.3652-1.3668.

The USD/CAD pair is demonstrating back-and-forth action below 1.3450 in the Tokyo session. The Loonie asset has muted after a perpendicular sell-off as investors are awaiting the release of the United States Nonfarm Payrolls (NFP) data for further guidance.
The US Dollar Index (DXY) is consolidating below 103.60 after a sheer fall inspired by dovish commentary from Federal Reserve (Fed) policymakers and a seventh straight contraction in the United States ISM Manufacturing PMI data.
Meanwhile, the Canadian Dollar showed some strength after a strong recovery in the oil price. At the press time, the oil price was trading sideways after a solid recovery inspired by easing hawkish Fed bets. It is worth noting that Canada is the leading exporter of oil to the United States and higher oil prices should support the Canadian Dollar.
USD/CAD witnessed a bloodbath after failing to surpass the supply zone plotted in a range of 1.3652-1.3668 on a four-hour scale. A formation of the Double Top chart pattern that supports a bearish reversal added to the downside filters.
The Relative Strength Index (RSI) (14) has shifted into the bearish range of 20.00-40.00, indicating more weakness ahead.
A further breakdown below June 01 low at 1.3436 will expose the Loonie asset to the horizontal resistances plotted around May 16 low at 1.3404 and May 08 low at 1.3315.
Ina n alternate scenario, a fresh buy would come above May 26 high at 1.3655, which would drive the asset toward the round-level resistance at 1.3700 followed by March 27 high at 1.3745.
USD/CAD four-hour chart
Author

Sagar Dua
FXStreet
Sagar Dua is associated with the financial markets from his college days. Along with pursuing post-graduation in Commerce in 2014, he started his markets training with chart analysis.


