USD/CAD Price Analysis: Bulls hit the wall above 1.3800 within rising trend channel


  • USD/CAD seesaws around the top line of a one-month-old bullish channel.
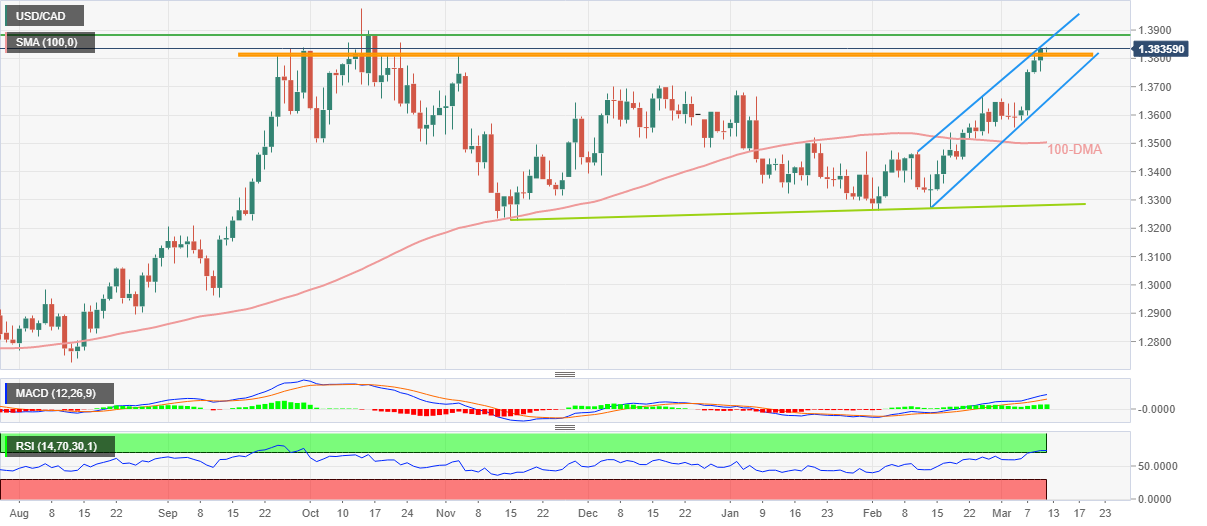
  • Clear upside break of the multi-day-old horizontal resistance, upbeat MACD signals favor buyers.
  • 100-DMA, ascending trend line from last November act as the key supports.

USD/CAD traces dicey markets as it makes rounds to 1.3825-35 during early Friday.

In doing so, the Loonie pair buyers struggle to cheer the previous day’s upside break of an important horizontal resistance area comprising multiple tops marked since late September 2022. The reason could be linked to the overbought RSI (14), as well as the cautious mood ahead of the key US and Canada employment report for February.

Also read: USD/CAD retreats towards 1.3800 as Oil bears take a breather, US/Canada employment data eyed

That said, the USD/CAD dribbles near the top line of a one-month-old ascending trend channel, close to 1.3860 by the press time, as the bullish MACD signals join the previous day’s clear break of the key upside hurdle surrounding 1.3805-15.

As a result, the bulls are likely to keep the reins and may overcome the immediate 1.3860 hurdle, however, the tops marked during October 14 and 17 of the last year, near 1.3885, as well as the 1.3900 threshold, could challenge the pair’s further upside.

In a case where the USD/CAD price remains firmer past 1.3900, the previous yearly high surrounding 1.3980 and the 1.4000 psychological magnet will be in focus.

On the contrary, bears remain off the table unless the USD/CAD price remains within the stated channel, currently between 1.3650 and 1.3860. It should be observed that the aforementioned horizontal resistance-turned-support near 1.3805-15 and the 1.3800 round figure limits the quote’s immediate downside

Even if the USD/CAD bears manage to conquer the 1.3650 support, the 100-DMA and a four-month-old ascending trend line, respectively near 1.3500 and 1.3280, will be crucial for them to watch.

USD/CAD: Daily chart

Trend: Limited upside expected

Additional important levels

Overview
Today last price 1.3829
Today Daily Change -0.0004
Today Daily Change % -0.03%
Today daily open 1.3833
 
Trends
Daily SMA20 1.3552
Daily SMA50 1.3474
Daily SMA100 1.3502
Daily SMA200 1.3307
 
Levels
Previous Daily High 1.3837
Previous Daily Low 1.3753
Previous Weekly High 1.3659
Previous Weekly Low 1.3534
Previous Monthly High 1.3666
Previous Monthly Low 1.3262
Daily Fibonacci 38.2% 1.3805
Daily Fibonacci 61.8% 1.3785
Daily Pivot Point S1 1.3778
Daily Pivot Point S2 1.3723
Daily Pivot Point S3 1.3694
Daily Pivot Point R1 1.3863
Daily Pivot Point R2 1.3892
Daily Pivot Point R3 1.3947


Share: Feed news

Information on these pages contains forward-looking statements that involve risks and uncertainties. Markets and instruments profiled on this page are for informational purposes only and should not in any way come across as a recommendation to buy or sell in these assets. You should do your own thorough research before making any investment decisions. FXStreet does not in any way guarantee that this information is free from mistakes, errors, or material misstatements. It also does not guarantee that this information is of a timely nature. Investing in Open Markets involves a great deal of risk, including the loss of all or a portion of your investment, as well as emotional distress. All risks, losses and costs associated with investing, including total loss of principal, are your responsibility. The views and opinions expressed in this article are those of the authors and do not necessarily reflect the official policy or position of FXStreet nor its advertisers. The author will not be held responsible for information that is found at the end of links posted on this page.

If not otherwise explicitly mentioned in the body of the article, at the time of writing, the author has no position in any stock mentioned in this article and no business relationship with any company mentioned. The author has not received compensation for writing this article, other than from FXStreet.

FXStreet and the author do not provide personalized recommendations. The author makes no representations as to the accuracy, completeness, or suitability of this information. FXStreet and the author will not be liable for any errors, omissions or any losses, injuries or damages arising from this information and its display or use. Errors and omissions excepted.

The author and FXStreet are not registered investment advisors and nothing in this article is intended to be investment advice.

Recommended content


Recommended content

Editors’ Picks

AUD/USD hovers around 0.6500 amid light trading, ahead of US GDP

AUD/USD hovers around 0.6500 amid light trading, ahead of US GDP

AUD/USD is trading close to 0.6500 in Asian trading on Thursday, lacking a clear directional impetus amid an Anzac Day holiday in Australia. Meanwhile, traders stay cautious due ti risk-aversion and ahead of the key US Q1 GDP release. 

AUD/USD News

USD/JPY finds its highest bids since 1990, near 155.50

USD/JPY finds its highest bids since 1990, near 155.50

USD/JPY keeps breaking into its highest chart territory since June of 1990 early Thursday, testing 155.50 for the first time in 34 years as the Japanese Yen remains vulnerable, despite looming Japanese intervention risks. Focus shifts to Thursday's US GDP report and the BoJ decision on Friday. 

USD/JPY News

Gold stays firm amid higher US yields as traders await US GDP data

Gold stays firm amid higher US yields as traders await US GDP data

Gold recovers from recent losses, buoyed by market interest despite a stronger US Dollar and higher US Treasury yields. De-escalation of Middle East tensions contributed to increased market stability, denting the appetite for Gold buying.

Gold News

Injective price weakness persists despite over 5.9 million INJ tokens burned

Injective price weakness persists despite over 5.9 million INJ tokens burned

Injective price is trading with a bearish bias, stuck in the lower section of the market range. The bearish outlook abounds despite the network's deflationary efforts to pump the price. Coupled with broader market gloom, INJ token’s doomed days may not be over yet.

Read more

Dow Jones Industrial Average hesitates on Wednesday as markets wait for key US data

Dow Jones Industrial Average hesitates on Wednesday as markets wait for key US data

The DJIA stumbled on Wednesday, falling from recent highs near 38,550.00 as investors ease off of Tuesday’s risk appetite. The index recovered as US data continues to vex financial markets that remain overwhelmingly focused on rate cuts from the US Fed.

Read more

Forex MAJORS

Cryptocurrencies

Signatures