USD/CAD Price Analysis: Bulls brace for a bumpy road to the north as US/Canada data looms


  • USD/CAD grinds higher after positing two-day winning streak.
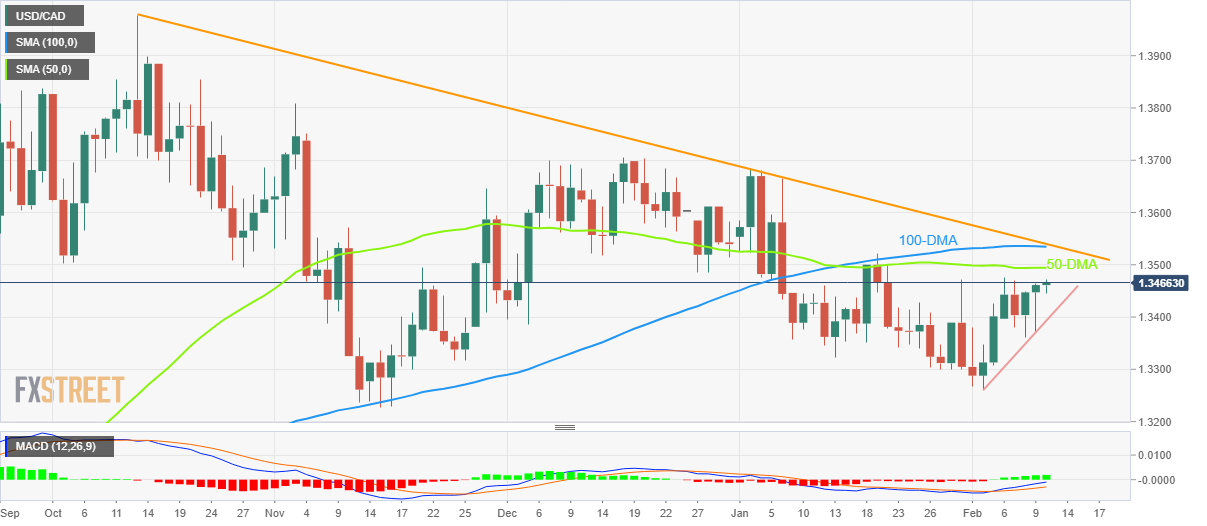
  • Bullish MACD signals, sustained trading beyond weekly support line favor buyers.
  • Convergence of 100-DMA, four-month-old resistance line appears a tough nut to crack for bulls.

USD/CAD teases buyers around 1.3465-70 heading into Friday’s European session, after a two-day uptrend, as the Loonie pair traders await crucial statistics from Canada and the US.  In doing so, the quote remains indecisive despite printing minor gains by the press time.

Also read: USD/CAD copies Oil’s inaction near mid-1.3400s, Canada employment, early signals for US inflation eyed

Even so, the bullish MACD signals join the pair’s successful trading above the weekly support line, around 1.3390 by the press time, to keep the buyers hopeful.

That said, the 50-DMA level surrounding 1.3500 guards the USD/CAD pair’s immediate upside before the convergence of the 100-DMA and descending resistance line from early October, close to 1.3540 at the latest.

In a case where the Loonie pair manages to stay beyond 1.3540, the previous monthly high of 1.3685 and the December 2022 peak surrounding 1.3705 will act as the last defense of the USD/CAD bears.

On the flip side, a clear break of the weekly support line, near 1.3390, will aim for the weekly low of 1.3360 before highlighting the monthly bottom surrounding 1.3260.

Should the USD/CAD prices remain weak past 1.3260, November 2022 low and the last July’s peak, respectively around 1.3235 and 1.3220, will gain the market’s attention.

USD/CAD: Daily chart

Trend: Further upside expected

Additional important levels

Overview
Today last price 1.3465
Today Daily Change 0.0004
Today Daily Change % 0.03%
Today daily open 1.3461
 
Trends
Daily SMA20 1.3388
Daily SMA50 1.3495
Daily SMA100 1.3536
Daily SMA200 1.3234
 
Levels
Previous Daily High 1.3463
Previous Daily Low 1.3373
Previous Weekly High 1.3472
Previous Weekly Low 1.3262
Previous Monthly High 1.3685
Previous Monthly Low 1.33
Daily Fibonacci 38.2% 1.3429
Daily Fibonacci 61.8% 1.3407
Daily Pivot Point S1 1.3401
Daily Pivot Point S2 1.3342
Daily Pivot Point S3 1.3311
Daily Pivot Point R1 1.3492
Daily Pivot Point R2 1.3523
Daily Pivot Point R3 1.3583


Share: Feed news

Information on these pages contains forward-looking statements that involve risks and uncertainties. Markets and instruments profiled on this page are for informational purposes only and should not in any way come across as a recommendation to buy or sell in these assets. You should do your own thorough research before making any investment decisions. FXStreet does not in any way guarantee that this information is free from mistakes, errors, or material misstatements. It also does not guarantee that this information is of a timely nature. Investing in Open Markets involves a great deal of risk, including the loss of all or a portion of your investment, as well as emotional distress. All risks, losses and costs associated with investing, including total loss of principal, are your responsibility. The views and opinions expressed in this article are those of the authors and do not necessarily reflect the official policy or position of FXStreet nor its advertisers. The author will not be held responsible for information that is found at the end of links posted on this page.

If not otherwise explicitly mentioned in the body of the article, at the time of writing, the author has no position in any stock mentioned in this article and no business relationship with any company mentioned. The author has not received compensation for writing this article, other than from FXStreet.

FXStreet and the author do not provide personalized recommendations. The author makes no representations as to the accuracy, completeness, or suitability of this information. FXStreet and the author will not be liable for any errors, omissions or any losses, injuries or damages arising from this information and its display or use. Errors and omissions excepted.

The author and FXStreet are not registered investment advisors and nothing in this article is intended to be investment advice.

Recommended content


Recommended content

Editors’ Picks

AUD/USD holds hot Australian CPI-led gains above 0.6500

AUD/USD holds hot Australian CPI-led gains above 0.6500

AUD/USD consolidates hot Australian CPI data-led strong gains above 0.6500 in early Europe on Wednesday. The Australian CPI rose 1% in QoQ in Q1 against the 0.8% forecast, providing extra legs to the Australian Dollar upside. 

AUD/USD News

USD/JPY sticks to 34-year high near 154.90 as intervention risks loom

USD/JPY sticks to 34-year high near 154.90 as intervention risks loom

USD/JPY is sitting at a multi-decade high of 154.88 reached on Tuesday. Traders refrain from placing fresh bets on the pair as Japan's FX intervention risks loom. Broad US Dollar weakness also caps the upside in the major. US Durable Goods data are next on tap. 

USD/JPY News

Gold price struggles to lure buyers amid positive risk tone, reduced Fed rate cut bets

Gold price struggles to lure buyers amid positive risk tone, reduced Fed rate cut bets

Gold price lacks follow-through buying and is influenced by a combination of diverging forces. Easing geopolitical tensions continue to undermine demand for the safe-haven precious metal. Tuesday’s dismal US PMIs weigh on the USD and lend support ahead of the key US macro data.

Gold News

Crypto community reacts as BRICS considers launching stablecoin for international trade settlement

Crypto community reacts as BRICS considers launching stablecoin for international trade settlement

BRICS is intensifying efforts to reduce its reliance on the US dollar after plans for its stablecoin effort surfaced online on Tuesday. Most people expect the stablecoin to be backed by gold, considering BRICS nations have been accumulating large holdings of the commodity.

Read more

US versus the Eurozone: Inflation divergence causes monetary desynchronization

US versus the Eurozone: Inflation divergence causes monetary desynchronization

Historically there is a very close correlation between changes in US Treasury yields and German Bund yields. This is relevant at the current juncture, considering that the recent hawkish twist in the tone of the Fed might continue to push US long-term interest rates higher and put upward pressure on bond yields in the Eurozone.

Read more

Forex MAJORS

Cryptocurrencies

Signatures