|

USD/CAD Price Analysis: Bulls are moving at a 50% mean reversion ahead of key US data

  • USD/CAD stalls on the correction post-BoC and bulls are holding the first at a 50% mean reversion.
  • USD/CAD's daily 61.8% Fibonacci resistance is a compelling target that meets structure and the 20 EMA. 

USD/CAD was a mover on Wednesday due to the Bank of Canada's interest rate decision whereby the pair shifted gears on the announcement, rallying from a low of 1.3340 to score a high of 1.3428 prior to correcting back into the rally following a consolidation around the BoC's governor, Tiff Macklem's, comments on the policy outlook and responses to questions from the press.

The following illustrates the price action that occurred over the event and prospects for a move higher, depending on the outcome of today;'s critical pre-Fedral Reserve meeting US economic data. 

USD/CAD H1 chart

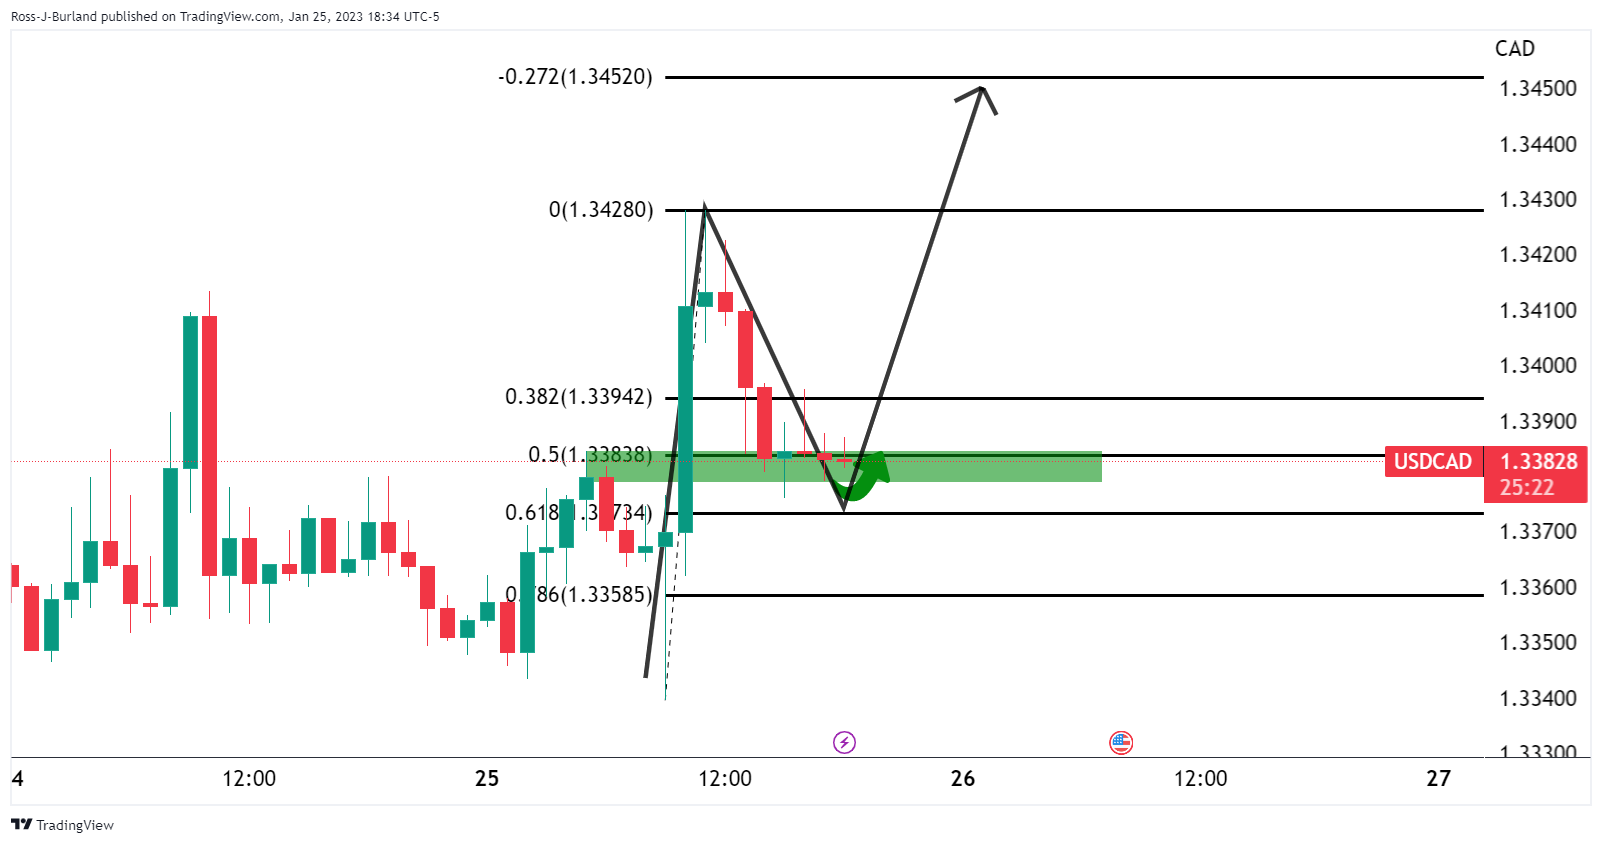
The correction has stalled at the 50% mean reversion of the move. This area also has a confluence with the prior resistance earlier in the week which raises the probability of a move up from here over the course of the next sessions, namely the London and US trade. 

USD/CAD daily chart

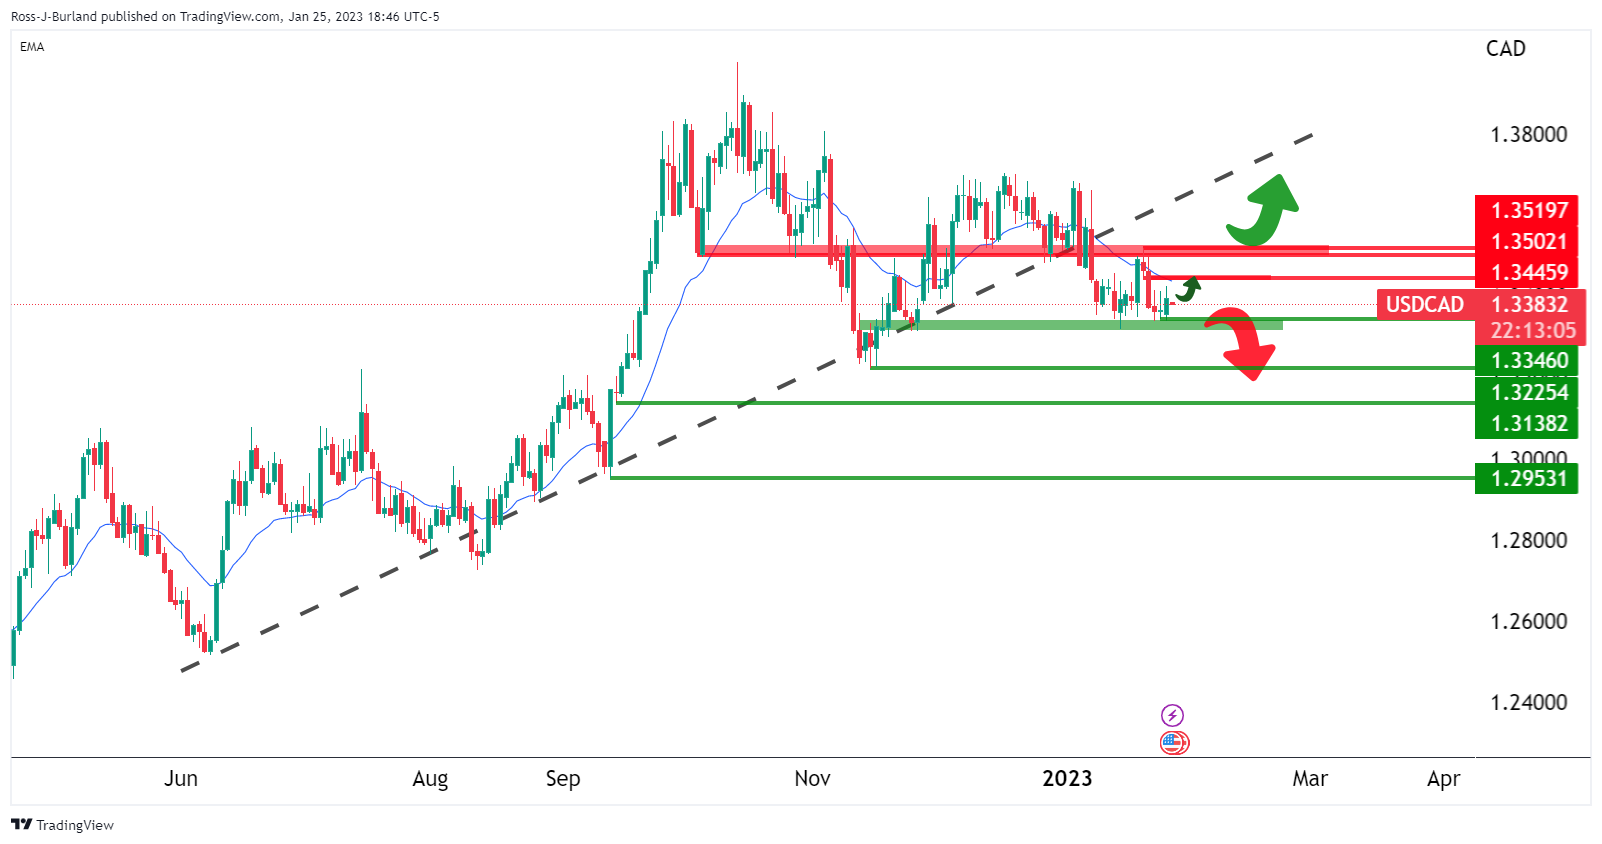
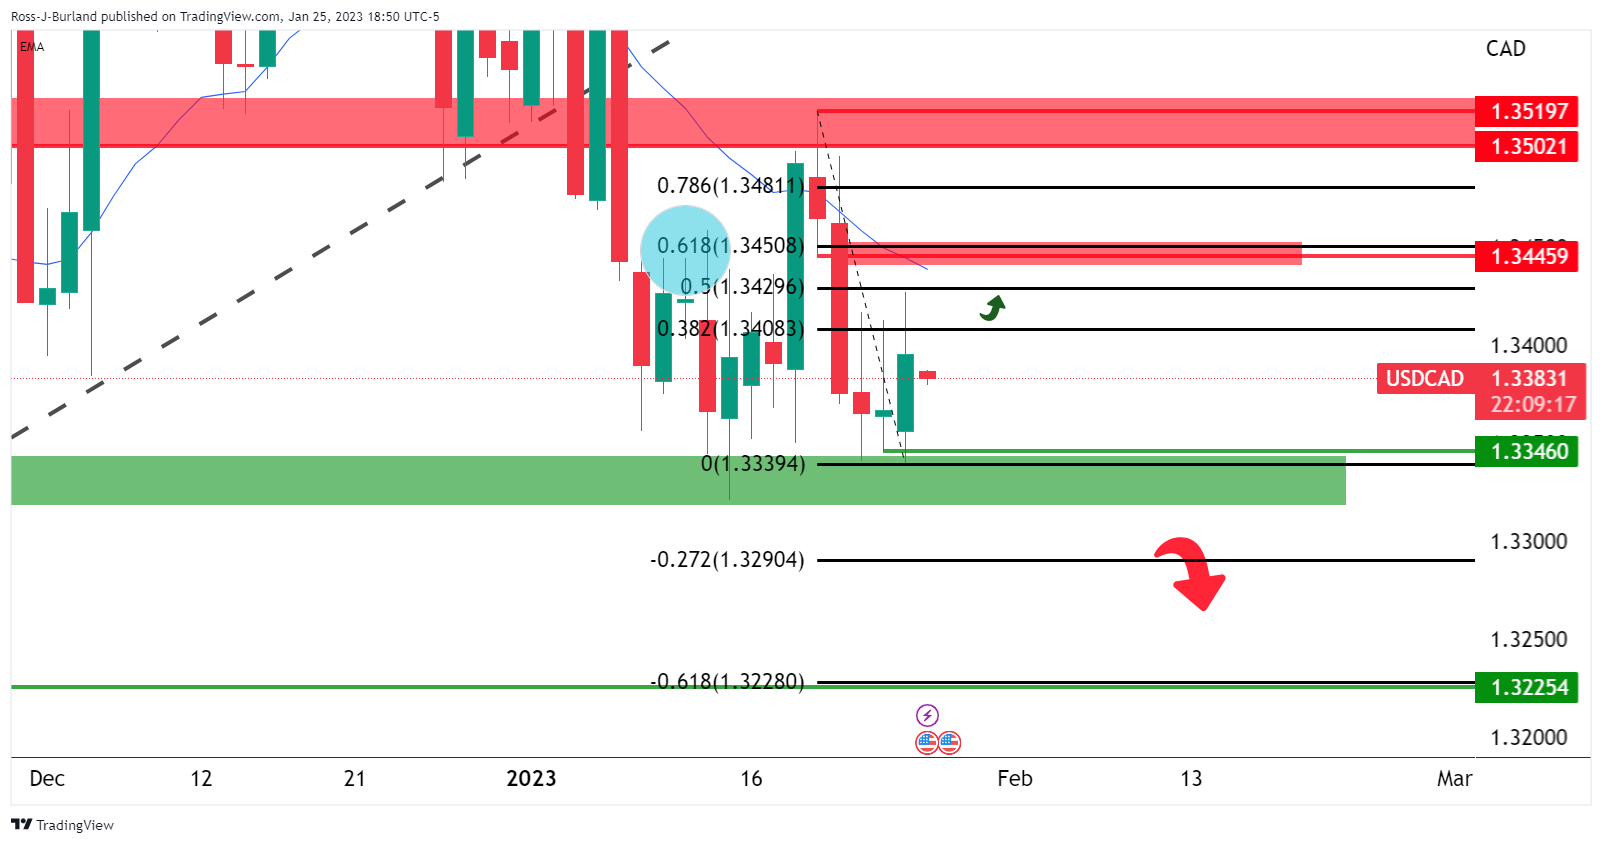
there would be prospects of a bullish breakout as per the above daily chart above should the bulls break above 1.3520. However, 1.3450 is guarded by the 20-day EMA and 1.3500 could also prove a tough area to break above. Meanwhile, the 61.8% Fibonacci resistance is a compelling target that meets structure and the 20 EMA:

Author

Ross J Burland

Ross J Burland, born in England, UK, is a sportsman at heart. He played Rugby and Judo for his county, Kent and the South East of England Rugby team.

More from Ross J Burland
Share:

Markets move fast. We move first.

Orange Juice Newsletter brings you expert driven insights - not headlines. Every day on your inbox.

By subscribing you agree to our Terms and conditions.

Editor's Picks

EUR/USD could test 1.1750 amid strengthening bullish bias

EUR/USD remains flat after two days of small losses, trading around 1.1740 during the Asian hours on Thursday. On the daily chart, technical analysis indicates a strengthening of a bullish bias, as the pair continues to trade within an ascending channel pattern.

GBP/USD consolidates above mid-1.3300s as traders await BoE and US CPI report

The GBP/USD pair struggles to capitalize on the overnight bounce from the 1.3310 area, or a one-week low, and oscillates in a narrow band during the Asian session on Thursday. Spot prices currently trade around the 1.3370 region, down less than 0.10% for the day, as traders opt to wait on the sidelines ahead of the key central bank event risk and US consumer inflation data.

Gold awaits weekly trading range breakout ahead of US CPI report

Gold struggles to capitalize on the previous day's move higher back closer to the $4,350 level and trades with a mild negative bias during the Asian session on Thursday. The downtick could be attributed to some profit-taking amid a US Dollar uptick, though it is likely to remain cushioned on the back of a supportive fundamental backdrop. 

Dogecoin breaks key support amid declining investor confidence

Dogecoin trades in the red on Thursday, following a 4% decline on the previous day. The DOGE supply in profit declines as large wallet investors trim their portfolios. Derivatives data shows a surge in bearish positions amid declining retail interest.

Monetary policy: Three central banks, three decisions, the same caution

While the Fed eased its monetary policy on 10 December for the third consecutive FOMC meeting, without making any guarantees about future action, the BoE, the ECB and the BoJ are holding their respective meetings this week. 

Dogecoin Price Forecast: DOGE breaks key support amid declining investor confidence

Dogecoin (DOGE) trades in the red on Thursday, following a 4% decline on the previous day. The DOGE supply in profit declines as large wallet investors trim their portfolios. Derivatives data shows a surge in bearish positions amid declining retail interest.