USD/CAD Price Analysis: Bounces off 200-EMA as bulls eye 1.3450


Share:
  • USD/CAD picks up bids to refresh intraday high, prints the first daily gains in four.
  • Bearish MACD signals, “double top” formation keeps Loonie pair sellers hopeful.
  • Multiple hurdles to challenge buyers, 1.3800 is the key upside hurdle.

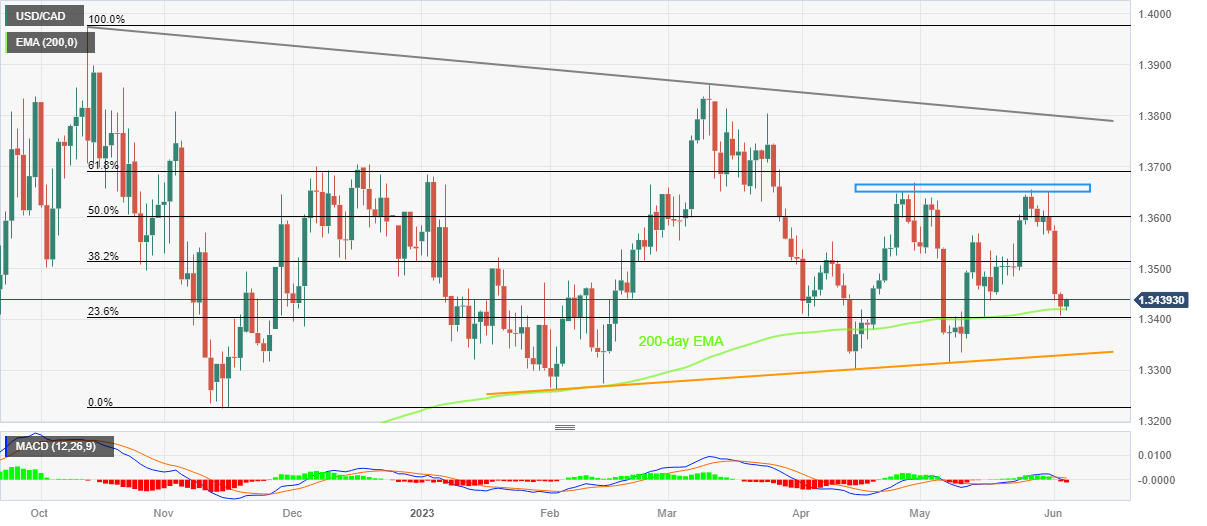
USD/CAD recovers from the key Exponential Moving Average (EMA) while snapping a three-day downtrend near 1.3440 heading into Monday’s European session. In doing so, the Loonie pair renews its intraday high while bouncing off the lowest levels in three weeks.

It’s worth noting that the quote’s recovery fails to justify bearish MACD signals and hence suggests limited upside room.

Even so, the USD/CAD pair’s rebound from the 200-EMA, around 1.3420 by the press time, allows the Loonie bears to aim for the 1.3500 threshold.

Following that, the 50% Fibonacci retracement level of the pair’s October-November 2022 downside, near 1.3600, can’t be ruled out.

However, a “double top” bearish chart pattern, with highs surrounding 1.3650-65, appears a tough nut to crack for the USD/CAD bulls.

Even if the Loonie pair defies the bearish formation by crossing the 1.3665 hurdle, a downward-sloping resistance line from late October 2022, close to 1.3800 by the press time, can challenge the pair buyers before giving them control.

Alternatively, a daily closing below the 200-EMA level of around 1.3420 could quickly drag the USD/CAD price towards a four-month-old upward-sloping support line, near 1.3330, a break of which will refresh the yearly low, currently around 1.3260.

USD/CAD: Daily chart

Trend: Limited recovery expected

Additional important levels

Overview
Today last price 1.3439
Today Daily Change 0.0014
Today Daily Change % 0.10%
Today daily open 1.3425
 
Trends
Daily SMA20 1.3505
Daily SMA50 1.3507
Daily SMA100 1.3518
Daily SMA200 1.3507
 
Levels
Previous Daily High 1.3452
Previous Daily Low 1.3407
Previous Weekly High 1.3651
Previous Weekly Low 1.3407
Previous Monthly High 1.3655
Previous Monthly Low 1.3315
Daily Fibonacci 38.2% 1.3424
Daily Fibonacci 61.8% 1.3435
Daily Pivot Point S1 1.3404
Daily Pivot Point S2 1.3383
Daily Pivot Point S3 1.3358
Daily Pivot Point R1 1.345
Daily Pivot Point R2 1.3474
Daily Pivot Point R3 1.3495


Share: Feed news

Information on these pages contains forward-looking statements that involve risks and uncertainties. Markets and instruments profiled on this page are for informational purposes only and should not in any way come across as a recommendation to buy or sell in these assets. You should do your own thorough research before making any investment decisions. FXStreet does not in any way guarantee that this information is free from mistakes, errors, or material misstatements. It also does not guarantee that this information is of a timely nature. Investing in Open Markets involves a great deal of risk, including the loss of all or a portion of your investment, as well as emotional distress. All risks, losses and costs associated with investing, including total loss of principal, are your responsibility. The views and opinions expressed in this article are those of the authors and do not necessarily reflect the official policy or position of FXStreet nor its advertisers. The author will not be held responsible for information that is found at the end of links posted on this page.

If not otherwise explicitly mentioned in the body of the article, at the time of writing, the author has no position in any stock mentioned in this article and no business relationship with any company mentioned. The author has not received compensation for writing this article, other than from FXStreet.

FXStreet and the author do not provide personalized recommendations. The author makes no representations as to the accuracy, completeness, or suitability of this information. FXStreet and the author will not be liable for any errors, omissions or any losses, injuries or damages arising from this information and its display or use. Errors and omissions excepted.

The author and FXStreet are not registered investment advisors and nothing in this article is intended to be investment advice.

Follow us on Telegram

Stay updated of all the news

Join Telegram

Recommended content


Follow us on Telegram

Stay updated of all the news

Join Telegram

Recommended content

Editors’ Picks

EUR/USD hits fresh daily lows under 1.0500

EUR/USD hits fresh daily lows under 1.0500

EUR/USD continued to face downward pressure and matched last week's low at 1.0487. It is hovering around 1.0500, as the US Dollar remains strong, supported by higher Treasury yields. The 10-year Treasury yield reached 4.70%, a level not seen since 2007.

EUR/USD News

GBP/USD drops to six-month lows, eyes 1.2100

GBP/USD drops to six-month lows, eyes 1.2100

GBP/USD retreated further and dropped to 1.2107, hitting the lowest since mid-April. The pair remains under pressure amid higher US Treasury yields, following better-than-expected ISM September Manufacturing PMI data.

GBP/USD News

Gold approaches $1,800 as demand for the USD prevails Premium

Gold approaches $1,800 as demand for the USD prevails

Spot Gold fell to a fresh multi-month low of $1,827.11 a troy ounce on Monday amid resurgent  US Dollar demand. The Greenback suffered a minor setback at the beginning of the week, as generally encouraging Chinese data and upbeat United States (US) news underpinned the mood.

Gold News

Three altcoins that have kickstarted Q4 rally: LINK, RDNT, FLOKI

Three altcoins that have kickstarted Q4 rally: LINK, RDNT, FLOKI

Crypto market volatility seems to be making a comeback with the start of 2023’s fourth quarter , and some altcoins are already making headway. Chainlink (LINK), Radiant Capital (RDNT) and Floki Inu (FLOKI) are some cryptos that are showing aggressive upside moves. 

Read more

NIO contracts 2% as Tesla delivery decline weighs on EV sector

NIO contracts 2% as Tesla delivery decline weighs on EV sector

Nio (NIO) stock dropped 2.3% on Monday morning despite meeting its quarterly delivery target for the third quarter. Tesla's (TSLA) Q3 production and delivery decline is the culprit.

Read more

Forex MAJORS

Cryptocurrencies

Signatures