|

USD/CAD Price Analysis: Ascending triangle in the hourly, to pave bulls way to 1.3500

  • USD/CAD is trading sideways, though in the short term, it is tilted upwards.
  • Near-term, the USD/CAD is upward biased as an ascending triangle emerges.

USD/CAD grinds higher during the North American session, erasing its earlier losses that witnessed the pair dropping to its low of the day at 1.3372. However, a late bounce in the New York session spurred an upward reaction, with the USD/CAD pair almost unchanged. At the time of writing, the USD/CAD exchanges hands at 1.3448.

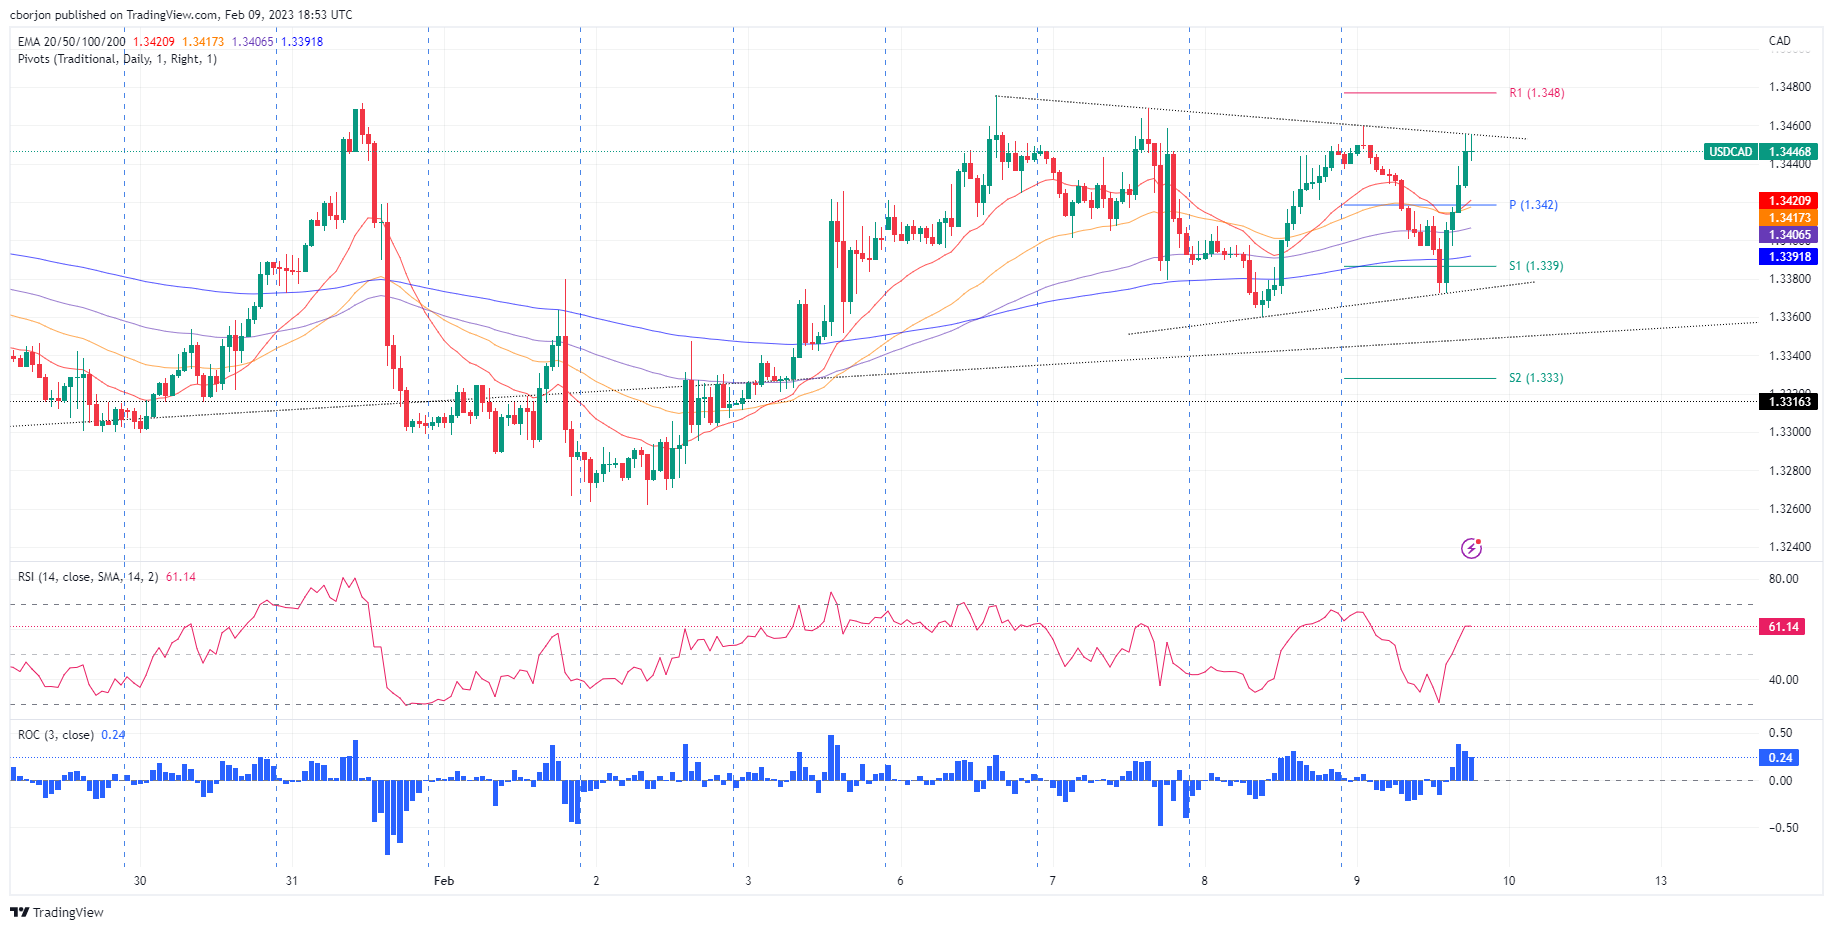
From a daily chart perspective, the USD/CAD remains neutral to upward biased, though the intersection of several support/resistance trendlines and the presence of the 50/100/20-day Exponential Moving Averages (EMAs) around 1.3402-1.3441 keep the USD/CAD trendless.

Nevertheless, although flat, the Relative Strength Index (RSI) is in bullish territory, keeping buyers hopeful for higher prices. On the other hand, the Rate of Change (RoC) suggests the USD/CAD might consolidate further, as it sits almost flat.

Upwards, the USD/CAD needs to clear the weekly high at 1.3475, which, once cleared, will exacerbate a leg-up toward 1.3500. on the flip side, the USD/CAD needs to break 1.3359, the weekly low, to challenge the psychological 1.3300 figure.

Short term, the USD/CAD one-hour chart suggests the pair as neutral-upwards. An ascendant triangle has formed, which, once cleared, the USD/CAD might rally towards its measured target objective at 1.3560/70.

USD/CAD One-hour chart

USD/CAD technical levels

USD/CAD

Overview
Today last price1.3445
Today Daily Change-0.0002
Today Daily Change %-0.01
Today daily open1.3447
 
Trends
Daily SMA201.3383
Daily SMA501.3494
Daily SMA1001.3536
Daily SMA2001.3231
 
Levels
Previous Daily High1.3449
Previous Daily Low1.336
Previous Weekly High1.3472
Previous Weekly Low1.3262
Previous Monthly High1.3685
Previous Monthly Low1.33
Daily Fibonacci 38.2%1.3415
Daily Fibonacci 61.8%1.3394
Daily Pivot Point S11.3389
Daily Pivot Point S21.333
Daily Pivot Point S31.33
Daily Pivot Point R11.3478
Daily Pivot Point R21.3508
Daily Pivot Point R31.3567

Author

Christian Borjon Valencia

Markets analyst, news editor, and trading instructor with over 14 years of experience across FX, commodities, US equity indices, and global macro markets.

More from Christian Borjon Valencia
Share:

Editor's Picks

EUR/USD slumps below 1.1750 as USD benefits from risk-aversion

EUR/USD comes under renewed bearish pressure in the European session and trades below 1.1750 following a recovery attempt earlier in the day. The US Dollar gathers strength and weighs on the pair as investors seek refuge in the wake of Israel and the United States' joint attack on Iran.

GBP/USD targets 1.3500 barrier near moving averages

GBP/USD rebounds from the daily losses, trading around 1.3450 during the Asian hours on Monday. The technical analysis of the daily chart indicates an ongoing bearish bias, as the pair trades within a descending channel pattern.

Gold surges on safe-haven demand, rises above $5,400

Gold benefits from intense risk-aversion on Monday and climbs above $5,400, setting a fresh monthly-high in the process. Tensions in the Middle East remain high as Israel and Hezbollah continue to exchange strikes following the US-Israel joint attack on Iran over the weekend.

Bitcoin, Ethereum and Ripple under pressure as key supports face breakdown risk

Bitcoin, Ethereum, and Ripple prices trade on the back foot at the start of this week on Monday, after extending losses in the previous week. BTC is on the brink of a breakdown, ETH is capped below key resistance, and XRP risks a crack of the trendline.

The market is paying for insurance, not apocalypse

As expected, this morning felt less like a Monday market open and more like a fire drill. Futures screens flickered red. S&P contracts down almost 1%. Nasdaq off 1.2%. Brent leaped 13% through $80. Gold rose 1.6% toward $5350 before paring some gains. The dollar is strutting mildly. The Swiss franc is quietly doing what it always does in a storm, catching some safe-haven flows.

Pi Network Price Forecast: Core team offloads supply, weighing on PI recovery

Pi Network  hovers below $0.1700, broadly steady at press time on Monday, attempting a recovery after a 2% loss the previous day. Sunday’s decline aligned with nearly 49 million PI tokens offloaded by the Pi Foundation, implying a spike in supply pressure that capped the prevailing four-day recovery.