|

USD/CAD Price Analysis: Air-kissing the Ascending Wedge goodbye

  • USD/CAD broke out of a bearish wedge pattern it has been rising in during 2024.
  • It stopped its downtrend, however, and returned back up to retest the lower borderline. 
  • This is likely a final test “goodbye”· before the pair resumes its bear move. 

USD/CAD has recently broken out of the Ascending Wedge pattern which it has been forming since January. 

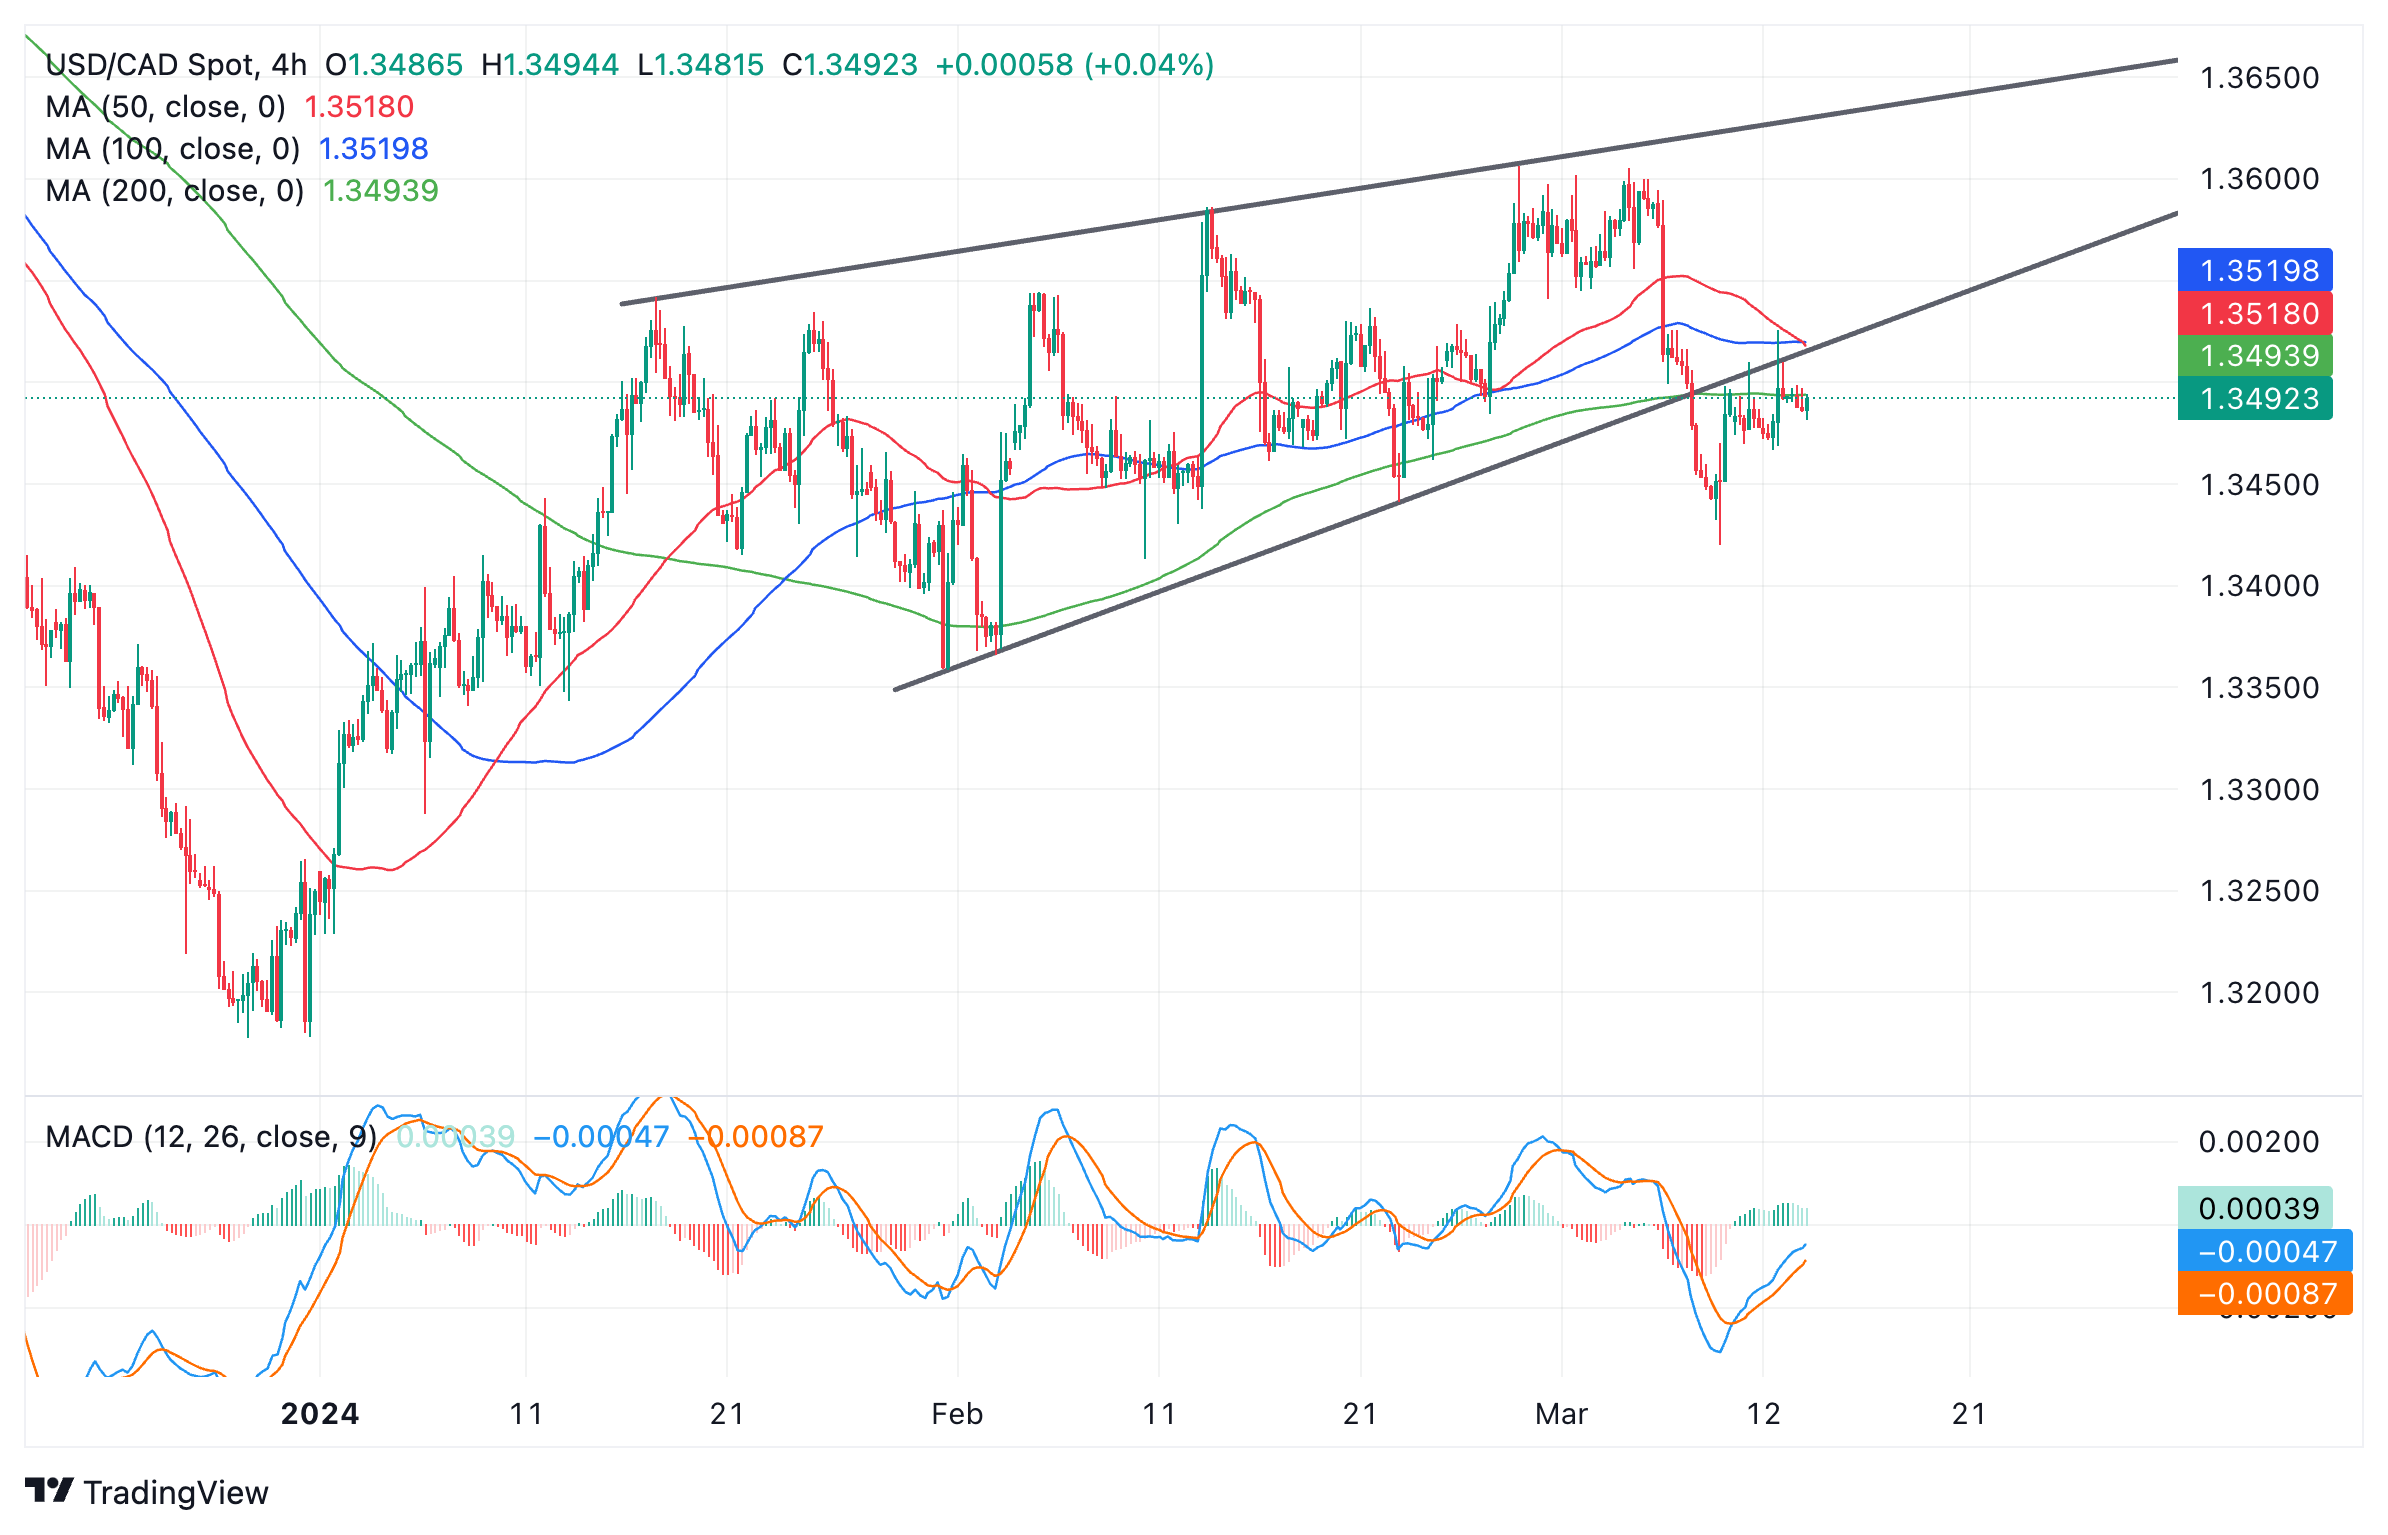
US Dollar versus Canadian Dollar: 4-hour chart

Downside following the breakout was curtailed and the pair turned around and climbed back up to the lower borderline of the wedge, where it currently trades.

It is not uncommon for price to return to a trendline for a final retest before pushing lower again, and this is what is probably happening on USD/CAD. 

The pair will probably “air-kiss” the borderline “goodbye”, therefore, before resuming its move lower. Bearish confirmation would probably come with a break below the last swing low at around 1.3466.

The height of the wedge at its widest point extrapolated lower offers an eventual target for the downside move at 1.3302. 

For the cautious, more conservative estimates would be the low of the wedge at 1.3358, or possibly even the Fibonacci 0.618 ratio of the pattern’s height at 1.3374. 

On the other hand, a break back inside the wedge pattern and above 1.3526 would cancel out the bearish view and suggest a bullish reversal was taking place.

Author

Joaquin Monfort

Joaquin Monfort is a financial writer and analyst with over 10 years experience writing about financial markets and alt data. He holds a degree in Anthropology from London University and a Diploma in Technical analysis.

More from Joaquin Monfort
Share:

Markets move fast. We move first.

Orange Juice Newsletter brings you expert driven insights - not headlines. Every day on your inbox.

By subscribing you agree to our Terms and conditions.

Editor's Picks

EUR/USD eyes 1.1800 barrier near two-month highs

EUR/USD extends its gains for the second consecutive day on Tuesday and approaches 1.1800. On the daily chart, technical analysis indicates a persistent bullish bias, as the pair moves upward within the ascending channel pattern. Additionally, the 14-day Relative Strength Index at 68.89 reaffirms the bullish bias.

GBP/USD climbs to 1.3500 area, renews ten-week high

GBP/USD extends its weekly rally and trades at its highest level since early October near 1.3500. The US Dollar remains under persistent bearish pressure heading into the holidays, while Pound traders largely brush off the latest interest rate cut from the Bank of England.

Gold approaches $4,500 as record-setting rally continues

Gold builds on Monday's impressive gains and advances toward $4,500, setting fresh record-highs along the way. Heightened geopolitical tensions, combined with the broad-based US Dollar (USD) weakness ahead of the Q3 GDP data, help XAU/USD preserve its bullish momentum.

Uniswap holds above $6 as traders eye UNIfication vote outcome

Uniswap price holds above $6 at the time of writing on Tuesday after closing above a key resistance zone in the previous week. Traders are focusing on the highly anticipated UNIfication proposal, which is set to conclude on Thursday, and could become a key near-term catalyst. On the technical side, momentum indicators are flashing bullish signals, hinting at an upside rally.

Ten questions that matter going into 2026

2026 may be less about a neat “base case” and more about a regime shift—the market can reprice what matters most (growth, inflation, fiscal, geopolitics, concentration). The biggest trap is false comfort: the same trades can look defensive… right up until they become crowded.

XRP steadies above $1.90 support as fund inflows and retail demand rise

Ripple (XRP) is stable above support at $1.90 at the time of writing on Monday, after several attempts to break above the $2.00 hurdle failed to materialize last week. Meanwhile, institutional interest in the cross-border remittance token has remained steady.