|

USD/CAD drops on US Dollar strength, amidst falling oil prices

  • The USD/CAD slid on market sentiment and high oil prices.
  • An offered US Dollar would keep the USD/CAD under heavy stress, as the USD/CAD eyes 1.3500.
  • USD/CAD Price Analysis: Would continue headed downwards unless buyers conquer 1.3600.

The Canadian Dollar (CAD) extended its gains against the US Dollar (USD) for three straight days, spurred by a risk-on impulse and overall US Dollar weakness. The buck is pressured on expectations for a less hawkish US Federal Reserve (Fed). The USD/CAD is trading at 1.3569 after printing a high of 1.3616.

Canadian Dollar boosted by high oil prices, risk appetite and soft USD

The USD/CAD continued its fall on higher oil prices, as Western Texas Intermediate (WTI) rose more than 6% weekly. Canada is one of the world’s major crude oil and natural gas exporters. Therefore, higher energy prices it usually underpins the Canadian Dollar.

Additionally, a softer US Dollar gave another leg-down to the USD/CAD pair, as it’s falling to a three-week low. However, the US Dollar Index (DXY), a barometer for the greenback’s value vs. a basket of six currencies, has paired some of its losses, gains 0.23%, at 102.665.

Traders should be aware that the Canadian Dollar, as a risk-perceived currency, would be subject to weakening on geopolitical tensions rise or sentiment shifts. As long as investors’ mood remains upbeat, the USD/CAD has room for another leg down, and it might test the 100-day Exponential Moving Average (EMA) at 1.3520.

Data-wise, the US economic docket featured Pending Home Sales for February, which rose by 0.8% MoM, above estimates for a plunge of 0.3%. Annually based, it decreased by 21.1%, less than the 29.4% plunge foreseen.

On the Canadian front, the docket featured the Bank of Canada (BoC) Deputy Governor Toni Gravelle. Gravelle did not speak about monetary policy; thought commented the BoC is ready to step in, if the banking system comes under pressure. He added that the BoC’s Quantitative Tightening (QT) program would run its course by the first half of 2025.

USD/CAD Technical analysis

USD/CAD Daily chart

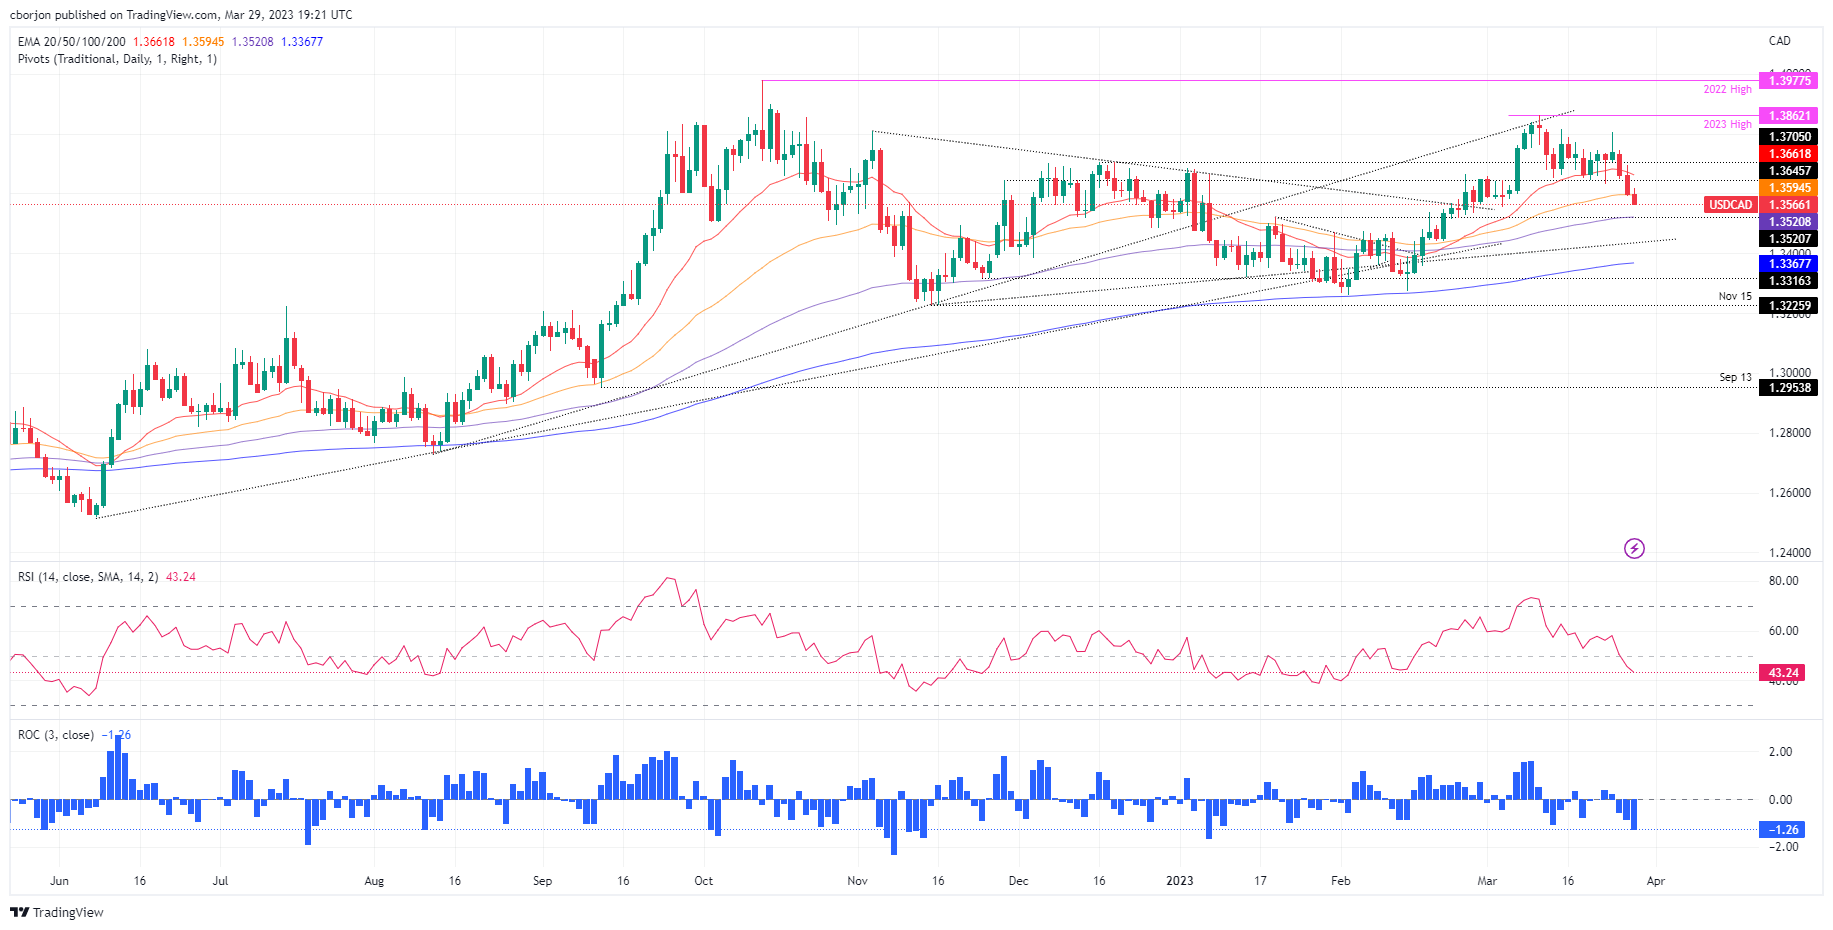
USD/CAD remains downward biased after dropping below the 50-day Exponential Moving Average (EMA) at 1.3594. a drop below 1.3550 will expose the 100-day EMA at 1.3520, ahead of testing 1.3500. Once cleared, a support trendline at around 1.3420/30 could be tested before retracing to 1.3400.

On the other hand, the USD/CAD buyers reclaiming the 50-day EMA at 1.3594 could pave the way to test 1.3600, followed by the 20-day EMA.

USD/CAD

Overview
Today last price1.3567
Today Daily Change-0.0034
Today Daily Change %-0.25
Today daily open1.3601
 
Trends
Daily SMA201.3704
Daily SMA501.3538
Daily SMA1001.3517
Daily SMA2001.3366
 
Levels
Previous Daily High1.3695
Previous Daily Low1.3592
Previous Weekly High1.3804
Previous Weekly Low1.3631
Previous Monthly High1.3666
Previous Monthly Low1.3262
Daily Fibonacci 38.2%1.3631
Daily Fibonacci 61.8%1.3656
Daily Pivot Point S11.3564
Daily Pivot Point S21.3526
Daily Pivot Point S31.346
Daily Pivot Point R11.3667
Daily Pivot Point R21.3733
Daily Pivot Point R31.377

Author

Christian Borjon Valencia

Christian Borjon began his career as a retail trader in 2010, mainly focused on technical analysis and strategies around it. He started as a swing trader, as he used to work in another industry unrelated to the financial markets.

More from Christian Borjon Valencia
Share:

Markets move fast. We move first.

Orange Juice Newsletter brings you expert driven insights - not headlines. Every day on your inbox.

By subscribing you agree to our Terms and conditions.

Editor's Picks

EUR/USD trades around 1.1700 after rebounding from 50-day EMA

EUR/USD gains ground after three days of losses, trading around 1.1700 during the Asian hours on Wednesday. On the daily chart, technical analysis indicates a potential for a bearish bias; the 14-day Relative Strength Index at 47 confirms waning momentum.

GBP/USD consolidates around 1.3500; looks to US macro data for fresh impetus

The GBP/USD pair oscillates in a narrow range, around the 1.3500 psychological mark during the Asian session on Wednesday, and for now, seems to have stalled the previous day's retracement slide from its highest level since September 18. Moreover, the fundamental backdrop seems tilted in favor of bullish traders and suggests that the path of least resistance for spot prices is to the upside.

Gold sees profit-taking decline after facing rejection at $4,500

Gold price sees a decline on profit-taking after facing rejection at $4,500 in the Asian trading hours on Wednesday. Despite the pullback, the traditional safe haven remains underpinned by geopolitical tensions and expectations of Fed rate cuts. The US ADP Jobs data, JOLTS Job Openings Survey and ISM Services Purchasing Managers Index report will be published on Wednesday. 

Pump.fun prepares for early-year rally as DEX volume skyrockets

Pump.fun (PUMP) is rising alongside crypto majors such as Bitcoin (BTC) and is trading above $0.002400 at the time of writing on Tuesday. The Decentralized Exchange (DEX) native token outlook builds on a bullish tone developed since December 30.

Implications of US intervention in Venezuela

Events in Venezuela are top of mind for market participants, and while developments are associated with an elevated degree of uncertainty, we are not making any changes to our markets or economic forecasts as a result of the deposition of Nicolás Maduro. 

Cardano holds steady as bulls intensify push for breakout

Cardano rises above the 50-day EMA resistance amid a risk-on mood across the crypto market. The MACD upholds positive divergence, increasing the potential for a 20% breakout to $0.505.