US stocks dive as UK, US bond yields surge, NASDAQ plunges
- NASDAQ caves as US, European bond yields jump higher.
- A US court has called Trump's tariffs unconstitutional, and US government could be forced to pay back tariffs.
- US 30-year Treasury briefly touches 5.00% on Tuesday.
- With a lower high already in place, traders watch for NASDAQ Composite to initiate downtrend with lower low.

September seems eager to prove its reputation as a poor month for stock market performance. On the first trading day of September after the Labour Day holiday, Tuesday opened with the NASDAQ Composite plunging down 1.85%.
The danger is coming from the bond market. US Treasury yields are soaring after a court struck down US President Donald Trump's tariff regime, calling it unconstitutional. The tariffs themselves remain in place as a lower court takes up further procedural issues with the case, but critics worry that the government might be forced to pay back hundreds of billions of dollars in collected tariffs. This would stretch an already hefty fiscal deficit with a large issuance of new Treasuries, the thinking goes.
Across the pond, UK Gilts are separately witnessing their highest yield levels since 1998 as that country deals with extremely high government deficits. Government bonds in Germany, France and the Netherlands also hit their highest yields since 2011, according to Deutsche Bank.
In the early going on Tuesday, the US 5-year Treasury saw yields rise over 1% to 3.77%, while the 30-year bounced lower after temporarily reaching 5.00%.
"Yields on longer-dated government bonds in advanced countries continue to rise, with the UK notably experiencing this alongside a weaker currency—similar to what is more usual for developing countries," said Mohamed El-Erian, Allianz's chief economic advisor.
NASDAQ 100 slides to 23,000
The NASDAQ 100 (NDX) found its footing after falling from above 23,473 to an intraday low of 21,044 on Tuesday morning. The 1-hour chart below displays buyers holding up the NASDAQ 100 before it reaches the August 20 and 22 lows around 23,000.
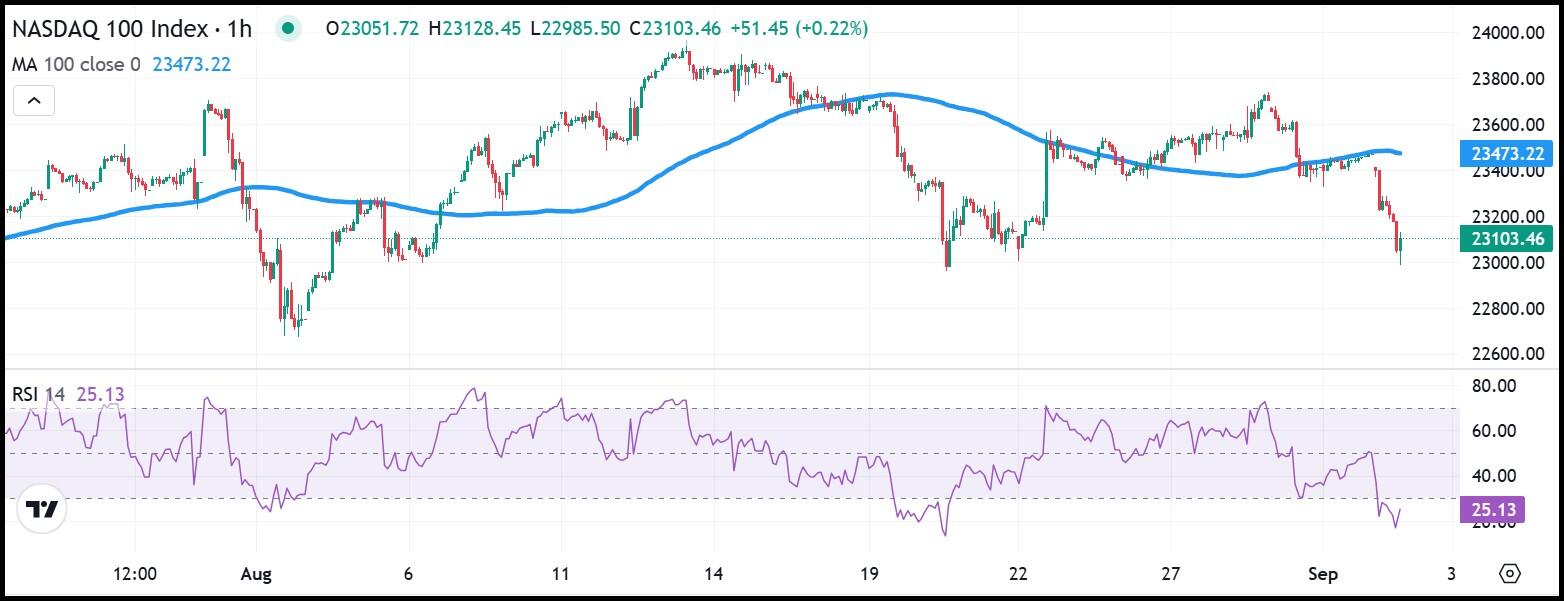
NASDAQ 100 1-hour chart
The NASDAQ Composite (IXIC) has not produced a lower low yet, but the daily chart below shows the index producing a lower high last Thursday, when the index couldn't reach the August 13 all-time high at 21,803. A new lower low will be completed if the index drops below the August 20 low at 20,905. It is already nearing the 50-day Simple Moving Average (SMA) near 20,955.
Any break there, and bears will expect the IXIC to drop to the 161.8 Fibonacci retracement at 20,351 or the 261.8% retracement at 19,453. The latter has a lot going for it as it intersects the 100-day and 200-day SMAs.
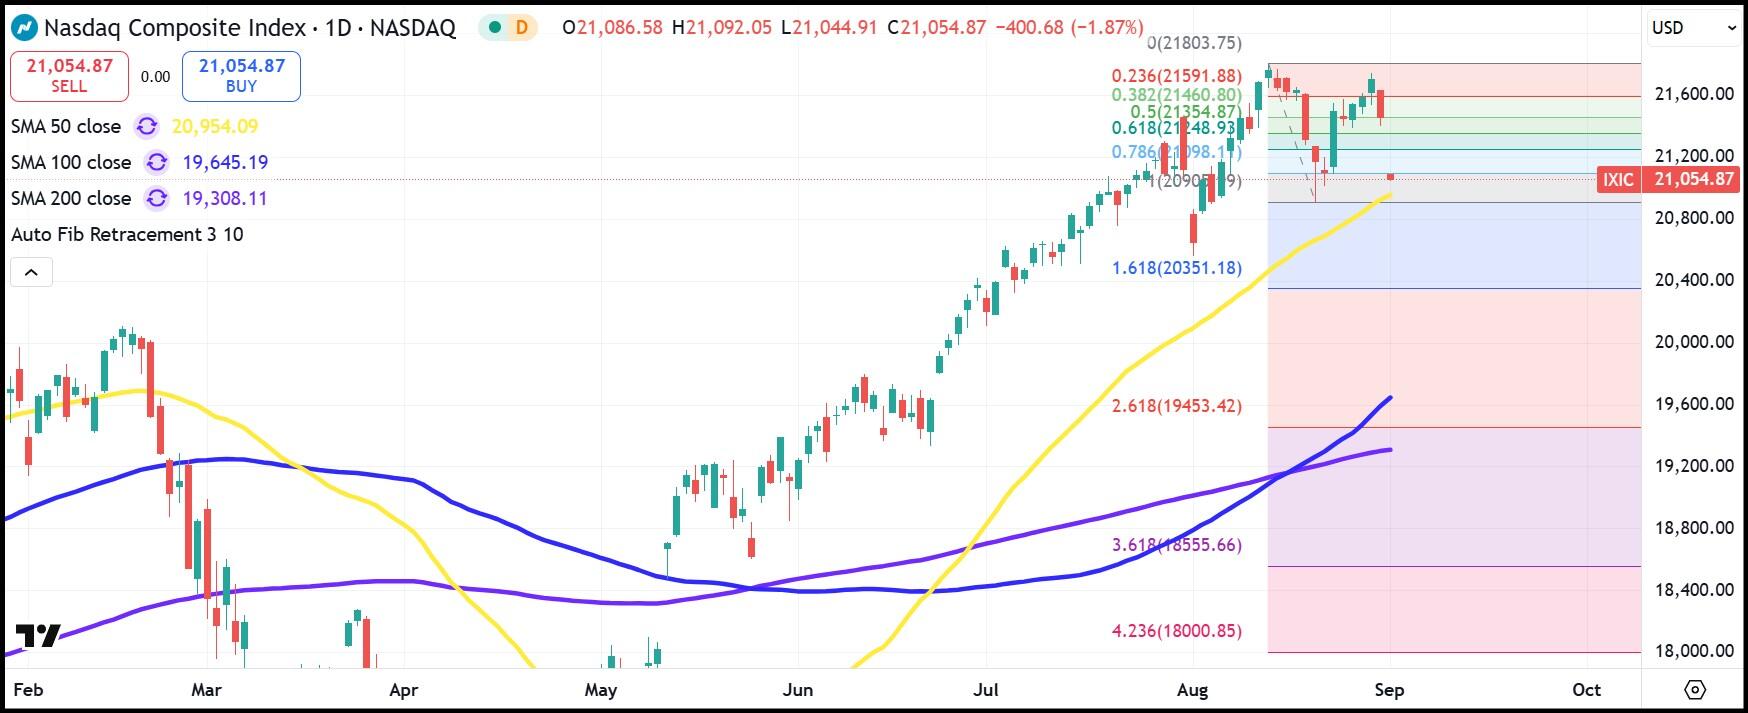
NASDAQ Composite daily chart
Premium
You have reached your limit of 3 free articles for this month.
Start your subscription and get access to all our original articles.
Author

Clay Webster
FXStreet
Clay Webster grew up in the US outside Buffalo, New York and Lancaster, Pennsylvania. He began investing after college following the 2008 financial crisis.


