US Dollar holds losses, markets asses Trump signals
- DXY erases Friday’s gains, slipping as European leaders back Ukraine peace deal guarantees.
- US Manufacturing PMI beats estimates, while ISM Manufacturing PMI misses expectations.
- Bond yields edge lower, reinforcing expectations of Fed rate cuts later in 2025.
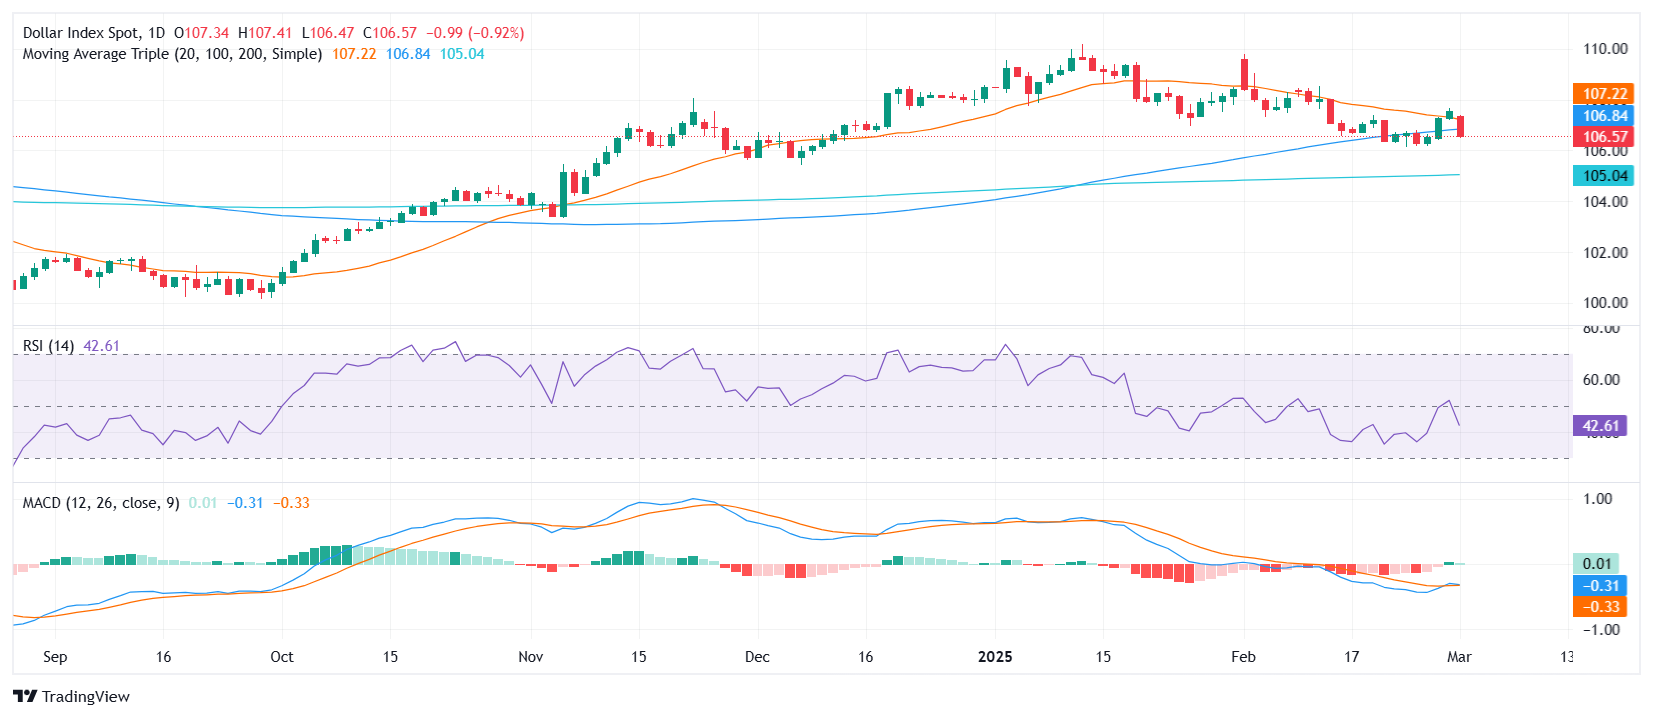
- Technical indicators suggest further downside as key moving averages converge near 107.00.

The US Dollar Index (DXY), which tracks the performance of the Greenback against a basket of six major currencies, is diving sharply on Monday as optimism surrounding a potential Ukraine peace deal weighs on safe-haven demand. European leaders have signaled their willingness to back security guarantees for Ukraine, boosting risk sentiment across global markets.
Meanwhile, United States (US) economic data provided mixed signals. The ISM Manufacturing PMI missed forecasts, while the S&P Global Manufacturing PMI came in stronger than expected. As a result, DXY slides back from last week's highs, undoing Friday’s advance. Regarding tariffs, Trump was on the wires on Monday during the American session and reiterated its plan to double Chinese tariffs from 10% to 20%, but had little impact on the USD.
Daily digest market movers: US Dollar plunges as geopolitical optimism lifts sentiment, US data comes mixed
- DXY tumbles as investors reduce safe-haven exposure amid Ukraine peace deal optimism. This came after several European leaders cooled down the jitters after Friday’s heated conversations between the American and Ukrainian presidents.
- On the data front, S&P Global’s final Manufacturing PMI for February exceeded estimates at 52.7, strengthening from the preliminary reading.
- ISM Manufacturing PMI came in at 50.3, slightly below the 50.5 forecast and down from January’s 50.9.
- The ISM Prices Paid subindex spiked to 62.4, surpassing estimates and accelerating from January’s 54.9.
- New Orders component dropped to 48.6, reflecting a significant decline from 55.1 in January.
- As a reaction, Wall Street trades mixed, with major US indices posting marginal gains and losses. US Treasury yields drift lower, extending the downtrend from last week’s highs.
- The CME FedWatch Tool indicates an increasing probability of a Fed rate cut in June, though some odds still favor steady rates.
DXY technical outlook: Bearish crossover looms as downside momentum builds
The US Dollar Index (DXY) turns lower, slipping below the 20-day and 100-day Simple Moving Averages (SMA), which are nearing a bearish crossover around the 107.00 level. Momentum indicators such as the Relative Strength Index (RSI) and Moving Average Convergence Divergence (MACD) are reinforcing the negative outlook. Key support levels emerge at 106.00 and 105.50, while 107.00 remains the first resistance level should the index attempt a rebound. However, with fundamental and technical factors aligning to the downside, further weakness is likely in the short term.
US-China Trade War FAQs
Generally speaking, a trade war is an economic conflict between two or more countries due to extreme protectionism on one end. It implies the creation of trade barriers, such as tariffs, which result in counter-barriers, escalating import costs, and hence the cost of living.
An economic conflict between the United States (US) and China began early in 2018, when President Donald Trump set trade barriers on China, claiming unfair commercial practices and intellectual property theft from the Asian giant. China took retaliatory action, imposing tariffs on multiple US goods, such as automobiles and soybeans. Tensions escalated until the two countries signed the US-China Phase One trade deal in January 2020. The agreement required structural reforms and other changes to China’s economic and trade regime and pretended to restore stability and trust between the two nations. However, the Coronavirus pandemic took the focus out of the conflict. Yet, it is worth mentioning that President Joe Biden, who took office after Trump, kept tariffs in place and even added some additional levies.
The return of Donald Trump to the White House as the 47th US President has sparked a fresh wave of tensions between the two countries. During the 2024 election campaign, Trump pledged to impose 60% tariffs on China once he returned to office, which he did on January 20, 2025. With Trump back, the US-China trade war is meant to resume where it was left, with tit-for-tat policies affecting the global economic landscape amid disruptions in global supply chains, resulting in a reduction in spending, particularly investment, and directly feeding into the Consumer Price Index inflation.
Author

Patricio Martín
FXStreet
Patricio is an economist from Argentina passionate about global finance and understanding the daily movements of the markets.