US Dollar Price Forecast: Remains capped below the 100-period EMA near 106.50
- The US Dollar Index recovers to near 106.50 in Wednesday’s early European session.
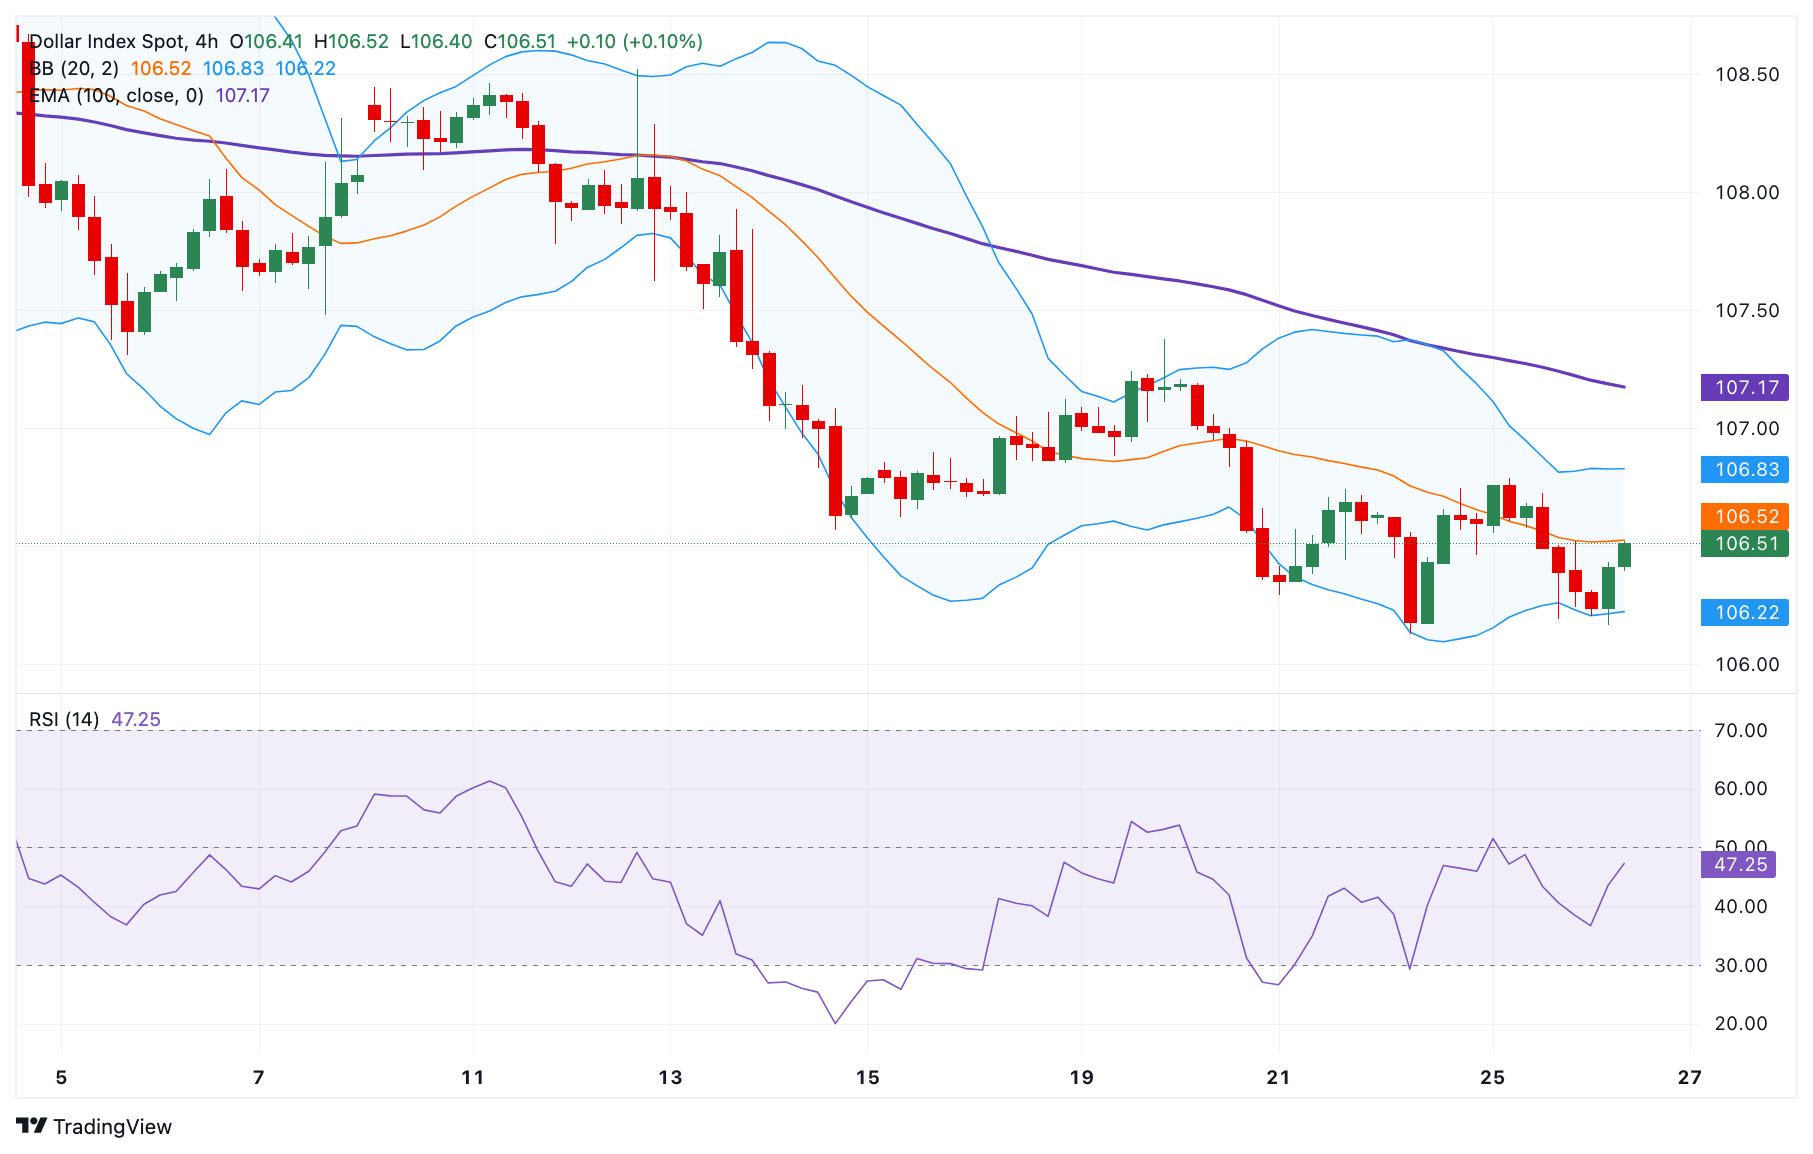
- The bearish outlook of the DXY remains intact below the 100-period EMA.
- The first downside target to watch is 106.20; the immediate resistance level emerges at 106.85.

The US Dollar Index (DXY) rebounds to around 106.50 during the early European session on Wednesday. Analysts expect that US President Donald Trump’s plans for higher tariffs have raised inflation worries at the US Federal Reserve (Fed), which might lead the Fed to keep interest rates higher for longer. This might support the US Dollar against its rivals.
Investors await the US Personal Consumption Expenditures (PCE) data, the Fed's preferred inflation gauge, on Friday for fresh impetus. This report might offer some hints about the US interest rate path.
Technically, the DXY keeps the bearish vibe on the 4-hour chart as the index remains capped below the key 100-period Exponential Moving Average (EMA). Additionally, the Relative Strength Index (RSI) stands below the 50-midline near 46.40, indicating that further downside cannot be ruled out in the near term.
The lower limit of the Bollinger Band at 106.20 acts as an initial support level for the US Dollar Index. A breach of this level could expose the 105.41, the low of December 6, 2024. The next contention level to watch is 104.19, the low of November 7, 2024.
On the bright side, the first upside barrier is located at 106.85, the upper boundary of the Bollinger Band. Extended gains could pave the way to the 107.15, the 100-period EMA. The next hurdle is seen at the 108.00 psychological level.
US Dollar (DXY) 4-hour chart
US Dollar FAQs
The US Dollar (USD) is the official currency of the United States of America, and the ‘de facto’ currency of a significant number of other countries where it is found in circulation alongside local notes. It is the most heavily traded currency in the world, accounting for over 88% of all global foreign exchange turnover, or an average of $6.6 trillion in transactions per day, according to data from 2022. Following the second world war, the USD took over from the British Pound as the world’s reserve currency. For most of its history, the US Dollar was backed by Gold, until the Bretton Woods Agreement in 1971 when the Gold Standard went away.
The most important single factor impacting on the value of the US Dollar is monetary policy, which is shaped by the Federal Reserve (Fed). The Fed has two mandates: to achieve price stability (control inflation) and foster full employment. Its primary tool to achieve these two goals is by adjusting interest rates. When prices are rising too quickly and inflation is above the Fed’s 2% target, the Fed will raise rates, which helps the USD value. When inflation falls below 2% or the Unemployment Rate is too high, the Fed may lower interest rates, which weighs on the Greenback.
In extreme situations, the Federal Reserve can also print more Dollars and enact quantitative easing (QE). QE is the process by which the Fed substantially increases the flow of credit in a stuck financial system. It is a non-standard policy measure used when credit has dried up because banks will not lend to each other (out of the fear of counterparty default). It is a last resort when simply lowering interest rates is unlikely to achieve the necessary result. It was the Fed’s weapon of choice to combat the credit crunch that occurred during the Great Financial Crisis in 2008. It involves the Fed printing more Dollars and using them to buy US government bonds predominantly from financial institutions. QE usually leads to a weaker US Dollar.
Quantitative tightening (QT) is the reverse process whereby the Federal Reserve stops buying bonds from financial institutions and does not reinvest the principal from the bonds it holds maturing in new purchases. It is usually positive for the US Dollar.
Author

Lallalit Srijandorn
FXStreet
Lallalit Srijandorn is a Parisian at heart. She has lived in France since 2019 and now becomes a digital entrepreneur based in Paris and Bangkok.


