- DXY keeps the downbeat mood near 99.60 ahead of Fed.
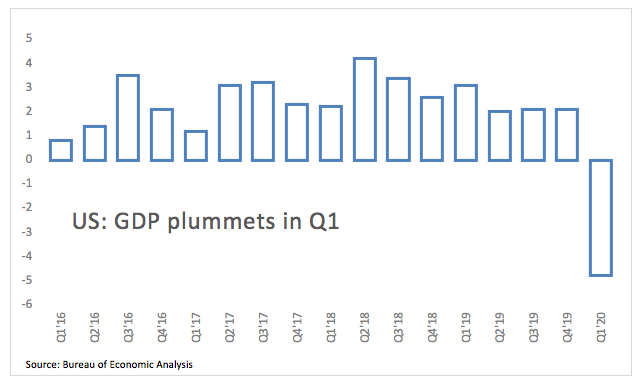
- US advanced Q1 GDP contracted 4.8%, missing consensus.
- The FOMC meeting is coming up next later in the NA session.
The US Dollar Index (DXY), which gauges the greenback vs. a basket of its main competitors, stays under pressure around the 99.60/50 band ahead of the FOMC event.
US Dollar Index offered on data, looks to FOMC
The index is down for the fourth consecutive day so far on Wednesday, coming under renewed downside pressure following last week’s failure to break above the 101.00 mark, which is acting as quite a tough barrier this month.
The better mood in the risk complex plus month-end flows have been also weighing on the buck as of late, particularly following encouraging news that the coronavirus outbreak continues to ebb in Europe.
In the US data space, preliminary readings showed the US economy is expected to contract at an annualized 4.8% during the January-March period, more than the 4.0% contraction initially predicted.
Still in the US, Pending Home Sales are next on tap seconded by the EIA’s weekly report on crude oil supplies. The FOMC gathering will close the daily calendar with no moves on rates although investors’ attention remains on any hint of changes to the fed’s forward guidance in light of the ongoing coronavirus crisis.
What to look for around USD
The dollar’s rally lost momentum once again in the vicinity of 101.00, where sellers re-emerged and dragged DXY back to the area below the 100.00 mark. In the meantime, all the attention remains on the coronavirus developments against the backdrop of increasing efforts by the country to re-open the economy, albeit at a gradual pace. On the supportive side of the dollar remains its status of “global reserve currency”, store of value and the investors’ preference when comes to seek refuge amidst financial stress. In the very near-term, the Fed’s forward guidance should remain on top of the debate at the FOMC event later on Wednesday.
US Dollar Index relevant levels
At the moment, the index is losing 0.36% at 99.60 and faces the next support at 99.45 (weekly low Apr.28) followed by 99.30 (55-day SMA) and then 98.82 (monthly low Apr.15). On the upside, a break above 100.49 (78.6% Fibo of the 2017-2018 drop) would aim for 100.93 (weekly/monthly high Apr.6) and finally 101.34 (monthly high Apr.10 2017).
Information on these pages contains forward-looking statements that involve risks and uncertainties. Markets and instruments profiled on this page are for informational purposes only and should not in any way come across as a recommendation to buy or sell in these assets. You should do your own thorough research before making any investment decisions. FXStreet does not in any way guarantee that this information is free from mistakes, errors, or material misstatements. It also does not guarantee that this information is of a timely nature. Investing in Open Markets involves a great deal of risk, including the loss of all or a portion of your investment, as well as emotional distress. All risks, losses and costs associated with investing, including total loss of principal, are your responsibility. The views and opinions expressed in this article are those of the authors and do not necessarily reflect the official policy or position of FXStreet nor its advertisers. The author will not be held responsible for information that is found at the end of links posted on this page.
If not otherwise explicitly mentioned in the body of the article, at the time of writing, the author has no position in any stock mentioned in this article and no business relationship with any company mentioned. The author has not received compensation for writing this article, other than from FXStreet.
FXStreet and the author do not provide personalized recommendations. The author makes no representations as to the accuracy, completeness, or suitability of this information. FXStreet and the author will not be liable for any errors, omissions or any losses, injuries or damages arising from this information and its display or use. Errors and omissions excepted.
The author and FXStreet are not registered investment advisors and nothing in this article is intended to be investment advice.
Recommended content
Editors’ Picks
EUR/USD extends losses on dovish remarks from ECB members, trades near 1.0780
EUR/USD continues its downward trend for the fourth consecutive day, driven by a stronger US Dollar influenced by the hawkish market sentiment surrounding the Federal Reserve and expectations of prolonged higher interest rates.
GBP/USD trades sideways above 1.2600 amid quiet session
The GBP/USD pair trades sideways around 1.2622 during the early Friday. The market is likely to be mute in light trading on Good Friday. Later in the day, the US Core Personal Consumption Expenditures Price Index will be released.
Gold ends Q1 2024 at record highs, what’s next?
Gold is sitting at an all-time high of $2,236, lacking a trading impetus amid holiday-thinned conditions on Good Friday. Most major world markets, including the United States are closed in observance of Holy Friday, leaving volatility around Gold price highly subdued.
Ripple's move above this key level could trigger nearly 50% rally for XRP
Ripple price has overcome a critical resistance level and flipped into a support floor on the weekly time frame. This development happened while XRP tightly consolidated for roughly 250 days. As this coiling up comes undone, investors can expect XRP to kickstart a massive rally.
US core PCE inflation set to ease in February on month as Federal Reserve rate cut bets for June mount
The core Personal Consumption Expenditures Price Index is set to rise 0.3% MoM and 2.8% YoY in February. The revised Summary of Projections showed that policymakers upwardly revised end-2024 core PCE forecast to 2.6% from 2.4%.